
This post is the second part of a series on how we built Bitbucket Data Center to scale. Check out the entire series here
Throttling Git
In our previous post we saw that when an under-provisioned Bitbucket instance starts hitting capacity constraints, performance degrades for all users. This usually manifests as longer page loading times and Git hosting response times as Bitbucket and many git processes vie for scarce CPU and memory.
All versions of Bitbucket since the very first release have applied a simple and effective strategy for dealing with this problem: Limit the number of Git hosting operations that are allowed to run concurrently. If too many users (or, more likely, build agents) are trying to perform too many Git hosting operations all at once, only some of them are processed immediately. The rest have to wait in a queue until the overall number of running Git hosting operations falls back below the limit again.
The part of Bitbucket that enforces this limit is called the _Throttle Service_. The way the Throttle Service works is to make each hosting operation acquire a ticket from a fixed pool of available tickets before it is allowed to proceed. The ticket pool acts like a car park with a fixed number of parking slots. When a car arrives the driver can enter and park only if the car park is not already full. If it is full they must queue outside until they are at the head of the queue and there is at least one vacancy. If they queue for too long they may give up and go home.
Throttling in Bitbucket works in much the same way: there are a fixed number of tickets and each Git operation must try to acquire one before proceeding. Operations that find there are no tickets left will queue for one (i.e., until the next Git operations finishes) or if delayed for too long will give up causing the Git client to receive a failure message. Operations aren’t allowed to build up in the queue indefinitely. If an instance comes under so much load that Git operations are stuck in the queue for more than 5 minutes, they are rejected with a message telling the user to try again later.
With throttling, Bitbucket not only prevents a few aggressive build agents from degrading performance for everyone, it can even improve the overall throughput for hosting operations too. This may seem counter-intuitive, but just think what can happen if you (say) double the concurrency level of a workload: If this pushes the system into “thrashing” due to CPU and/or memory exhaustion, it can easily lead to each job in the pipeline taking more (sometimes much more) than double the time to run, leading to lower throughput overall.
The only tricky bit was deciding how many tickets Bitbucket should allow in the pool. If it allows too few, users pushing to or pulling from repositories might have to wait longer (or have their requests rejected) even though the server’s resources aren’t under pressure. If it allows too many, a system could experience resource exhaustion, and performance could suffer for everyone. The “optimal” number for an instance in all situations can actually depend on a lot of factors, like the CPU speed, I/O performance, network speed, and even the average size of repositories in the instance. The decision we took was to let the limit be configured by the administrator, with the default calculated by a simple formula: 1.5 x the number of CPU cores available in the machine. This scales the available ticket count with the size of the machine, so larger machines have more available tickets and smaller machines, fewer.
This approach to Git operations has served Bitbucket quite well and the default has been a reasonable choice for many instances. But for some with ample hardware resources and a hosting load consisting of many small, light Git operations, the “one size fits all” approach of a single fixed limit can sometimes lead to underutilization of the server hardware.
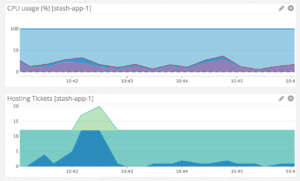
This diagram from a Datadog console for one of our production Bitbucket clusters shows such a situation. In the bottom graph dark blue represents the number of held tickets or Git operation in progress, aqua represents the fixed total number of tickets, and lime represents the number of queued requests. Here too many lightweight Git operations have arrived too quickly and instantly exceed the fixed ticket count meanwhile the CPU remains underutilized. This server could be processing more operations but fixed throttling is causing them to be queued instead. Users and CI servers are being held up but the server is only just warm.
So finding the optimal ticket limit for all instances in all situations was sometimes harder than we’d like. In Bitbucket 4.11, we set out to change all that…
Introducing Adaptive throttling
In 4.11 we introduced a new feature called adaptive throttling which we believe goes a good way towards achieving this goal.
Adaptive throttling in Bitbucket 4.11 works a bit like cruise control in a car. Just as cruise control can achieve a steady speed by applying the accelerator or brakes when it detects that the car’s speed is higher or lower than the desired level, Bitbucket 4.11 also monitors load in your system continuously, and “opens up the throttle” (i.e., allows more Git hosting operations through) when it detects that the system is lightly loaded, and “hits the brakes” (by allowing fewer Git hosting operations) when it detects that the system is under stress.
Compared to fixed throttling, this strategy gives you the best of both worlds: When your machine has capacity to spare, Bitbucket allows as many concurrent Git hosting operations as you can throw at it. But if it starts to strain under the load, Bitbucket dynamically detects this and winds back the ticket limit, protecting the overall responsiveness of the whole system.
The metric that Bitbucket uses to measure the “stress” of the system is the overall CPU utilization, as reported by the operating system.
Bitbucket monitors this statistic continuously (smoothed to filter out noise), as well as the actual number of Git hosting tickets in use at the time. Bitbucket aims to achieve a constant CPU target (75% by
default) if there is enough workload to sustain it. An estimate of how many more Git hosting operations the instance could sustain and still remain under the target is calculated by applying a simple linear extrapolation formula. (This of course has to assume that all Git hosting operations consume about the same amount of CPU on average, an assumption which actually turns out to hold pretty well in practice.) This formula gives a value that Bitbucket then applies as the new total ticket count. Bitbucket keeps dynamically recalculating the new ticket count all the time, allowing it to respond to spikes or other sudden changes in system load in just a few seconds.
The following diagrams illustrate how the fixed and adaptive throttling algorithms respond to different kinds of load spike.
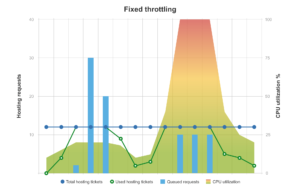
If a flurry of “light” Git hosting operations hits the instance (as in the left hand side of this chart), Bitbucket can queue requests even though the machine still has plenty of CPU resources to spare.
If on the other hand a spike of “heavy” (i.e., CPU intensive) Git hosting operations hits the instance (as in the right hand side), Bitbucket doesn’t queue the requests enough, and they hog all the available CPU at the expense of other operations. This can impact page load times and general responsiveness of the instance.
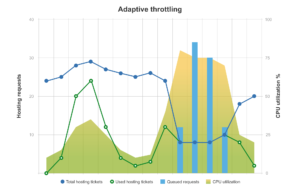
Flurries of “light” Git hosting operations are allowed to proceed without queuing so long as the CPU utilization stays under the 75% target.
But for “heavy” Git hosting operations, adaptive throttling detects the CPU load exceeding the target and “slams on the brakes” by reducing the Total hosting ticket limit. This causes queuing of Git operations, protecting the system from extended high CPU load.
The 75% CPU target is configurable, and represents a balance between throughput and responsiveness. A higher target can squeeze more throughput out of the instance, but potentially at the expense of response times. A lower target keeps the system very light and responsive, but can lead to more queuing of Git hosting operations.
Since Bitbucket now adapts the ticket limits depending on circumstances, it also needs safeguards so that extreme circumstances don’t result in extreme over-reactions. For instance stubbornly high CPU should not completely starve Bitbucket Server of Git operations no matter how poorly the server is coping. (The high CPU could easily be from some process unrelated to Bitbucket so reducing the ticket limit all the way down to zero probably wouldn’t have the desired effect anyway.) Nor should a burst of initially-idle Git operations be able to fool adaptive throttling into waving through even more operations only to have a CPU and memory crunch come down the line once they all wake up. To this end adaptive throttling allows you to specify the minimum and maximum range for the ticket limit. The minimum (a default of 1 x CPU cores) establishes a base service level for concurrent Git operations. The maximum (a default of 12 x CPU cores) acts as a safety net.
Also note that while adaptive throttling chooses CPU load as its “north star” in terms of how it should adapt the ticket limit, it also takes machine memory into consideration. On startup Bitbucket Server looks at the total system memory and does a simple calculation of how many Git processes could fit in memory resident with Bitbucket and its search service. For some low-memory systems this may reduce the maximum operation limit from its default or configured value but is generally necessary to protect against ticket limits that could not be achieved, realistically, from the available hardware.
Monitoring in production
So how does Adaptive throttling perform in a real instance? Within Atlassian, we monitor both the machine level stats (CPU, memory, IOPS, etc.) and many JMX statistics on all our production Bitbucket instances with New Relic and Datadog. The JMX statistics in particular give us excellent insight into what’s going on “under the hood” in our instances.
The JMX MBean exposed by Bitbucket for the throttling algorithm is called com.atlassian.bitbucket:name=HostingTickets. The Total attribute is the maximum number of Git hosting operations that Bitbucket calculates each node can cope with, the Used attribute is how many are in flight, and the QueuedRequests attribute indicates how many requests are waiting for a hosting ticket.
The following 24 hour window from our New Relic console shows the spikiness of the Git hosting workload on one of our production instances in a typical workday.
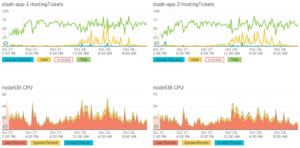
The proportional control algorithm in adaptive throttling has done a pretty good job at estimating the Total number hosting operations a Bitbucket node can cope with (line in green), both in busy periods and quiet ones. Thanks to this kind of monitoring, we have been able to tune our CPU utilization target and bring down the number of QueuedRequests (line in blue) on this instance, without harming responsiveness.
This instance, by the way, is running on 8x CPU cluster nodes with 24 GBytes of memory each. Under the previous fixed throttling algorithm, the default Total hosting ticket count would have been 12. With Adaptive throttling, we now can (and do) allow up to 8 times this number. The throughput of Git hosting operations is much higher as a result, and request queuing on this instance is now extremely rare, happening only very briefly if it gets hit by a particularly bad “build storm” from one of our fellow dev teams with a lot of builds (ahem, Confluence…).
This graph from our Datadog console show a much shorter window of ten minutes (from a different period) on the same instance. By zooming in we can see more clearly how adaptive throttling responds to sustained periods of high CPU.
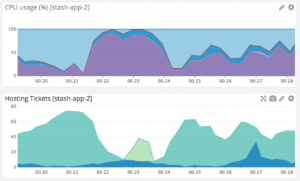
In the bottom of the two graphs the dark blue represents Used tickets, aqua represents Total tickets, and lime represents QueuedRequests. We can see that at around the 00:21 mark there is a modest rise in the number of Git operations followed by a sudden spike in CPU where it hovers around the 100% mark for 2 to 3 minutes. In response adaptive throttling drives the Total ticket count from around 70 down to its configured minimum of 8. This causes a spike in queued requests but is enough breathing space for the CPU-intensive Git operations to complete, allow CPU load to fall, let Total tickets rise again and allow queued requests to begin.
JMX is an extremely powerful tool to monitor the capacity and general health of a Bitbucket instance, and there are many tools out there that can monitor the JMX statistics exposed by Bitbucket. Apart from com.atlassian.bitbucket:name=HostingTickets, some of the key MBeans in Bitbucket that we monitor all the time are:
- com.zaxxer.hikari:type=Pool (bitbucket) This shows the state of Bitbucket’s database connection pool. The ActiveConnections attribute is the most important statistic. The maximum pool size is 80 by default, but in general Bitbucket should get along pretty well with a small number (less than, say, 5) active connections per node even under very heavy load. If ActiveConnections goes higher than about 40, something is probably wrong! The “something” might not be the database itself, it could just as easily be something else external like your LDAP or network.
- com.hazelcast:instance=hazelcast,name=operationServicehazelcast, type=HazelcastInstance.OperationService This one might be a mouthful, but is actually quite useful as it gives various statistics on cluster nodes’ interactions with each other. The executedRemoteOperationCount attribute is an indicator on how much inter-node activity is going on within your cluster.
Some tools, like Datadog, can be set up to send alerts to a HipChat room if a threshold is crossed. The Bitbucket dev team uses these as an “early warning sign” of possible trouble.