Debugging and troubleshooting an extension
Debugging an extension point can help you find out why your extension is not working as it should. This page describes how to debug a Client-Side Extension, including:
- How to identify if the extension was loaded on the page
- Why the extension didn't show up on the page
This guide assumes you are an extension developer (plugin developer), and you created an extension that doesn't work for some unknown reason.
This guide requires basic knowledge about the Atlassian plugin system and some experience with debugging HTML applications by using the browser DevTools. To troubleshoot an extension, you should know:
- How to turn on browser DevTools and how to use the console panel.
- How to install browser extensions.
- How to use
altasCLI commands.
You should also know:
- Your Atlassian plugin key, that can be found in the
atlassian-plugin.xmlfile.
How to check whether the extension loaded on the page
Before you start troubleshooting the extension code, first, you should first ensure that the Atlassian plugin system loaded your plugin and that your extension was loaded on the page.
Check if your plugin was loaded
-
First, you need to start the application, open the web browser, and navigate to the administration panel of your application.
-
If you are using a local instance of Bitbucket or Bitbucket CSE Template project to develop the plugin, then use
adminas the user andadminas the password to log in into the administration panel. -
Next, find and navigate to the Manage Apps page.
-
On the list of all installed plugins, locate your plugin using App key (plugin key), and check whether all the plugin's modules are enabled:
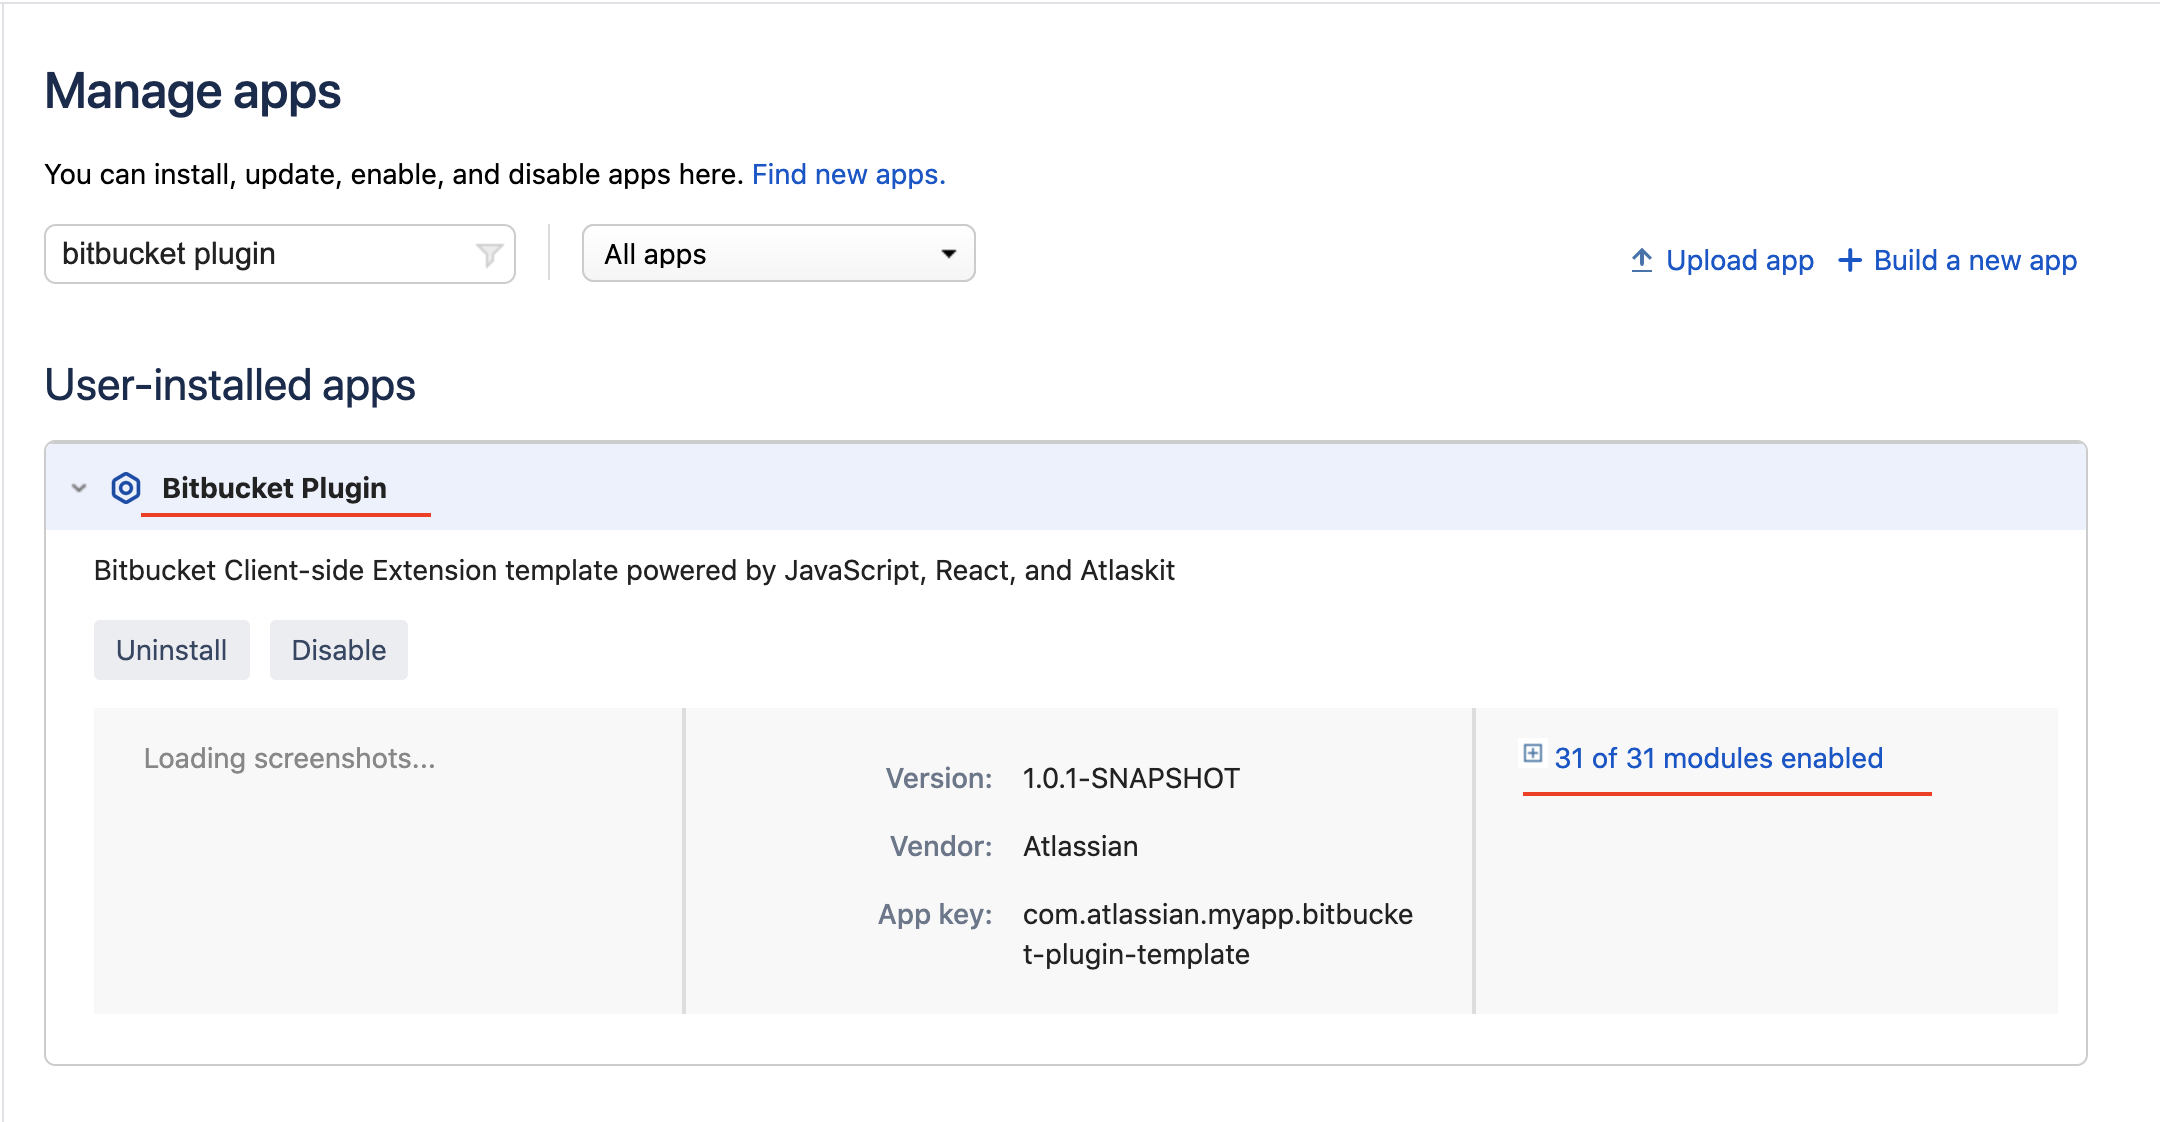
-
If your plugin is on the list and all the modules are enabled, you can proceed to the next step.
If you haven't found the plugin on the list, you should try checking and inspecting the application log files. Depending on the application you are running the logs might be located in a different locations:
Check if the extension was loaded
Now that you know your plugin was loaded, you can check if the extension was loaded on the page.
-
Install the Atlassian Browser DevTools Chrome extension. Open a web browser, turn on the DevTools and select the ABD tab.
-
Navigate to the page where you should see the extension point.
-
If the extension point is located in a different tab, e.g. Diff tab, select this tab on the page.
-
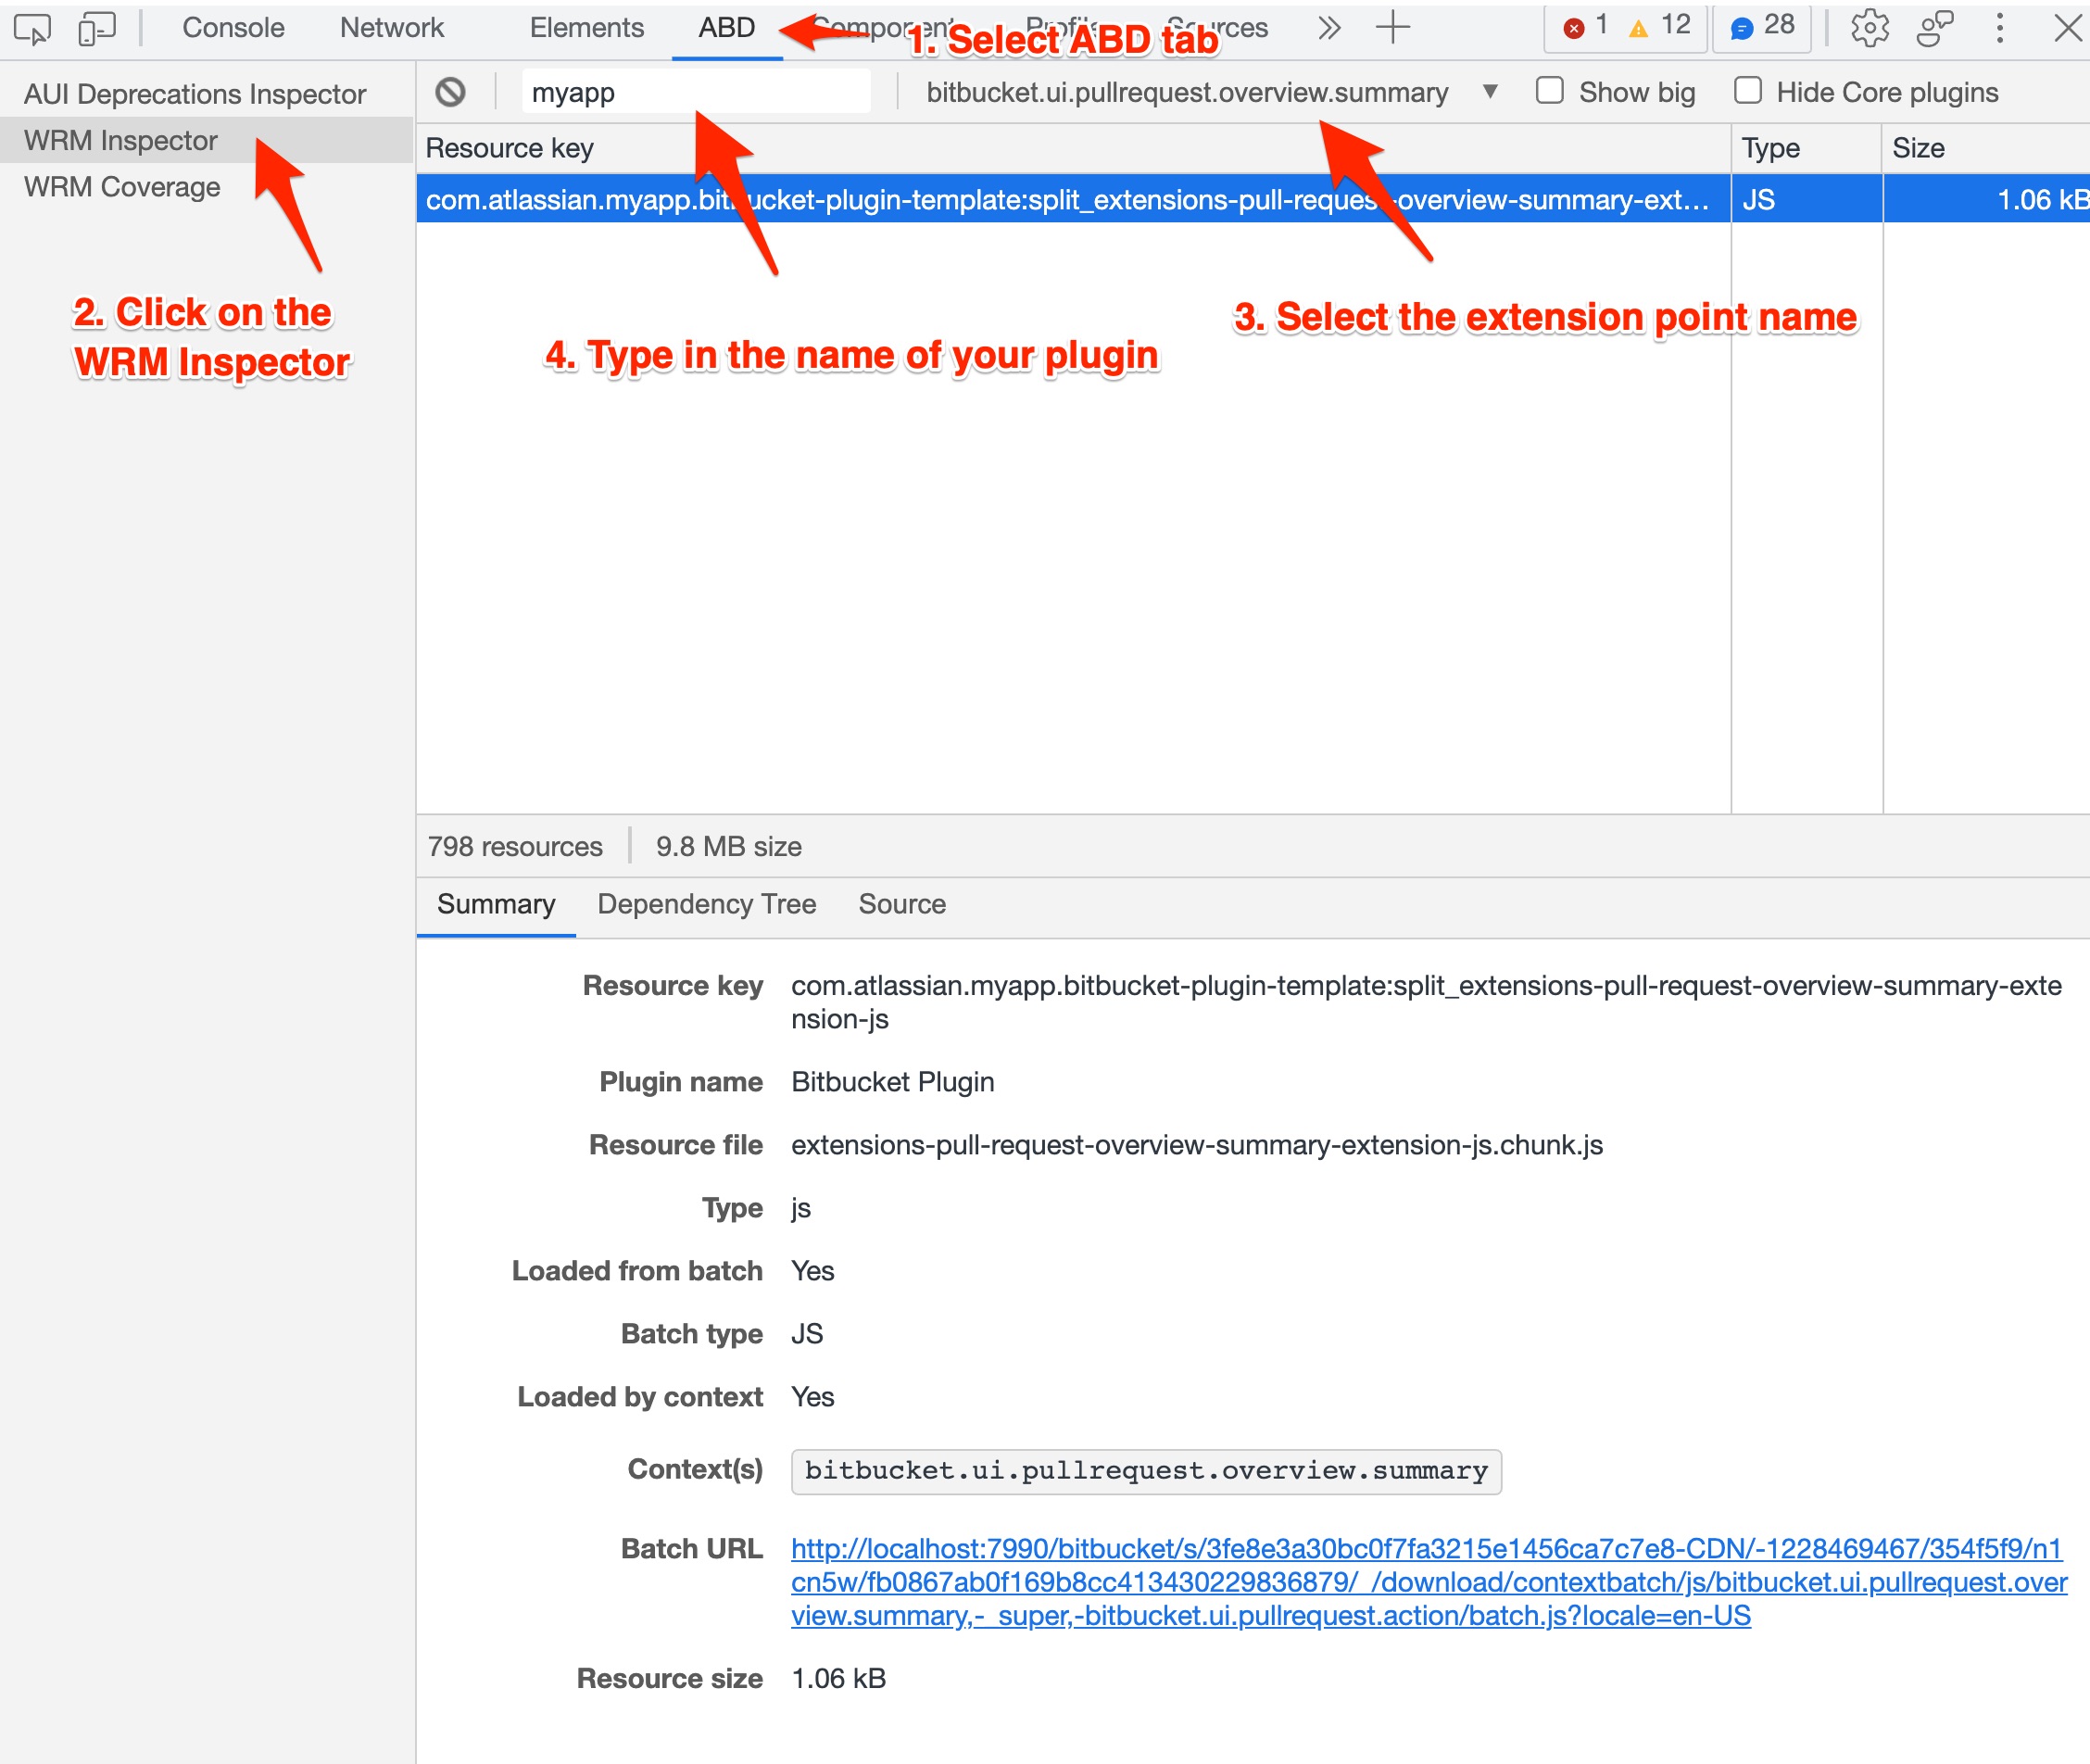
Now, in the DevTools window, select the ABD tab and choose the WRM Inspector option.
-
The WRM inspector allows you to see a list of all the web-resources loaded on the page. To filter the list and find a web-resource with your extension code:
- Click on the All context option and select the name of the extension point
- In the Filter field, type in part of your plugin name
-
If you can find your web-resource on the list, it means that your extension was configured correctly, and it can be loaded on the page.
If you can't find the web-resource with your extension, please check if the configuration of the webpack CSE plugin is correct. For more information refer to the guides:
What to do when the extension did load but is not rendered on the page?
CSE includes a debug mode that is disabled by default. You can enable the debug mode programmatically using the APIs from the @atlassian/clientside-extensions-debug package.
To enable the runtime debug mode in your extension, follow these steps.
-
Install the
@atlassian/clientside-extensions-debugpackage:1 2
yarn add -D @atlassian/clientside-extensions-debug # or npm install --save-dev @atlassian/clientside-extensions-debug -
Next, import the debug module in your code and use debug functions:
1 2
// my-extension.js import { ModalExtension } from '@atlassian/clientside-extensions'; // 1. Add package import { setDebugEnabled, setLoggingEnabled } from '@atlassian/clientside-extensions-debug'; /** * @clientside-extension * @extension-point bitbucket.ui.pullrequest.overview.summary */ export default ModalExtension.factory((extensionAPI, context) => { // 2. Turn on the debug mode and enable logging setDebugEnabled(true); setLoggingEnabled(true); return { label: 'Click to open a modal', onAction: (modalAPI) => { modalAPI.setTitle('Look, a Modal!'); modalAPI.onMount((container) => { container.innerHTML = '<p>Hello World!</p>'; }); }, }; }); -
If you are using webpack with watch mode, you should see the page reload after saving the changes. If not, use the
atlas-package -DskipTestscommand to rebuild your plugin and once it's done, manually refresh the page. -
Open the browser's developer tools and select the Console tab. In the same browser window, navigate to the page that should render your extension.
-
If your extension is causing any problems you should see relevant information in the console tab, .e.g.
-
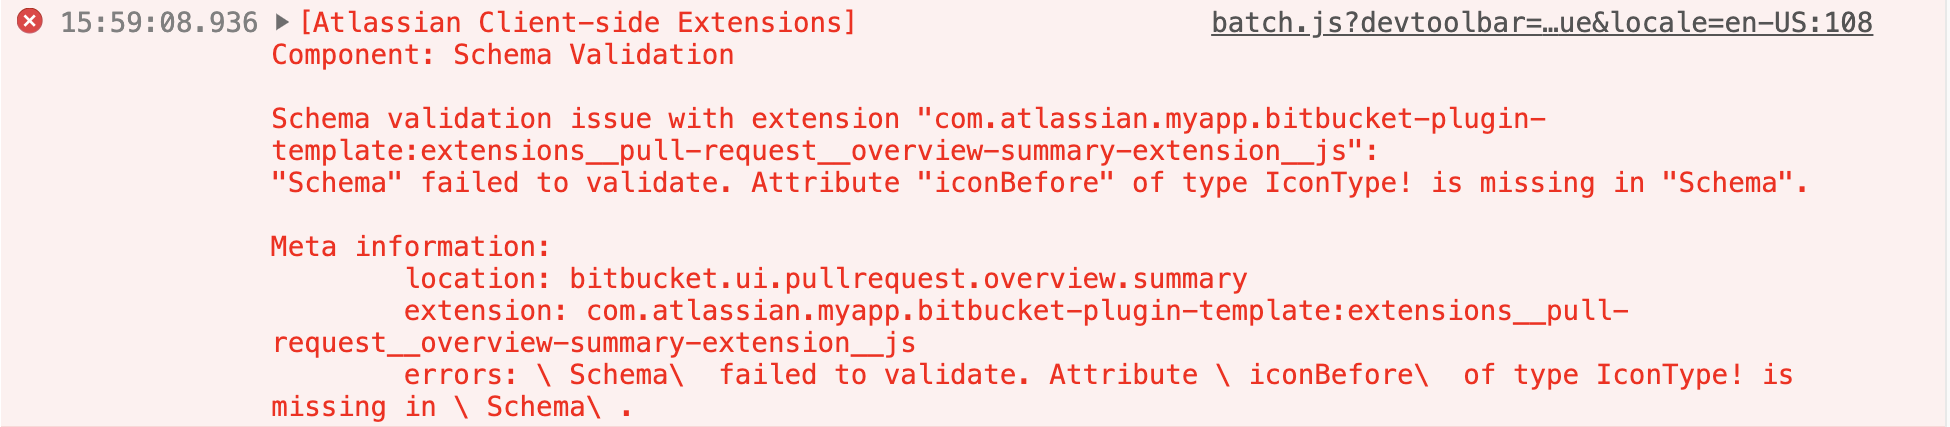
Taking a look at the example image with the error:
1 2
Schema validation issue with extension "<<extension name>>": "Schema" failed to validate. Attribute "`iconBefore`" of type `IconType`! is missing in "Schema". Meta information: - location: `bitbucket.ui.pullrequest.overview.summary` - extension: <<extension name>>The example validation error is showing information on what attributes are missing for the
bitbucket.ui.pullrequest.overview.summaryextension point. In this case, we need to provide theiconBeforeattribute that is required.
The above error is caused by missing required attributes.
To catch mistakes like this sooner in development, you can turn on the discovery mode which will reveal location of extension points, and the list of required attributes for a given extension point.
Remember to include the *-debug package and turning the debug mode only in the development environment.
The extension code shouldn't include the, e.g. setDebugEnabled(true) calls when you create a production version of the plugin.
Further help
If you followed the guide but are still not sure why the extension doesn't work, you can report the issue in the Client-side Extensions project.
Click on the "Create" issue button and provide the reproduction steps. Please include as much information as you can, including:
- Application name and version
- A version of CSE modules you are using
- Browser vendor name and version
Rate this page: