- ADF renderer
- Atlassian icon (Preview)
- Atlassian tile (Preview)
- Badge
- Box
- Button
- Button group
- Calendar
- Chart - Bar
- Chart - Donut
- Chart - Horizontal bar
- Chart - Horizontal stack bar
- Chart - Line
- Chart - Pie
- Chart - Stack bar
- Checkbox
- Checkbox group
- Code
- Code block
- Comment
- Comment editor
- Chromeless editor
- Date picker
- Dynamic table
- Empty state
- File card (EAP)
- File picker (EAP)
- Form
- Frame
- Heading
- Icon
- Image
- Inline
- Inline edit
- Link
- List
- Lozenge
- Modal
- Popup
- Pressable
- Progress bar
- Progress tracker
- Radio
- Radio group
- Range
- Section message
- Select
- Spinner
- Stack
- Tabs
- Tag
- Tag group
- Text
- Text area
- Text field
- Time picker
- Tile (Preview)
- Toggle
- Tooltip
- User
- User group
- User picker
- XCSS
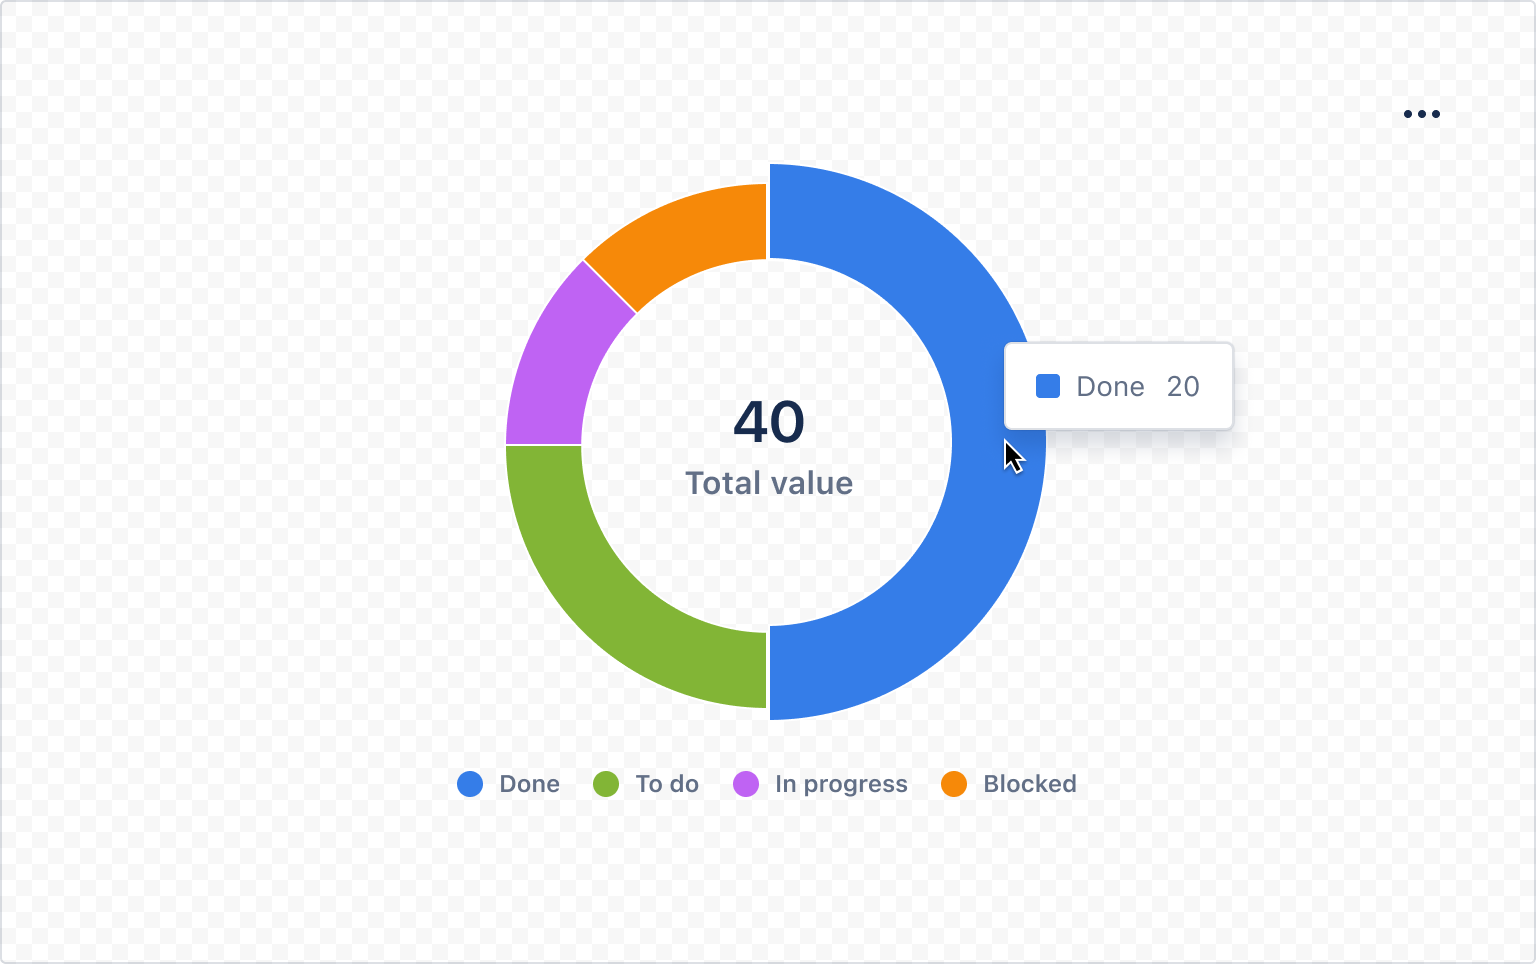
Donut chart
A visual representation of data in a donut format.
You must be on @forge/react major version 11.2.0 or higher to use the latest version of UI Kit components. To install:
1
2npm install --save @forge/react@latest
To add the DonutChart component to your app:
1
2import { DonutChart } from '@forge/react';
Props
| Name | Type | Required | Description |
|---|---|---|---|
colorAccessor | number | string | Yes | Accessor to define the color grouping. This can be a numerical or string index. For more information on all accessors, see Data. |
colorPalette | string[] | { key: string; value: string }[] | No | Custom color palette for the chart. Can be an array of color strings (e.g., ['#0052CC', '#FF5630']) or an array of objects with key and value properties to map specific data categories to colors (e.g., [{ key: 'category1', value: '#0052CC' }]). |
data | unknown[] | Yes | Data can be one of two formats:
|
height | number | No | The static height of the chart in pixels. Defaults to 400. |
innerRadius | number | No | Sets the hole size in the center. A larger value makes the donut thinner, while 0 creates a full pie. |
labelAccessor | number | string | Yes | Accessor to define the labels. |
outerRadius | number | No | Controls the chart’s overall size. Must be greater than innerRadius to maintain the donut shape. |
showMarkLabels | boolean | No | Boolean to display labels on top of each slice. Defaults to false. |
subtitle | string | No | A string value that represents the subtitle of the chart. This appears below the title. |
title | string | No | A string value that represents the title of the chart. |
valueAccessor | number | string | Yes | Accessor to define the angle of arcs in a donut. |
width | number | No | The static width of the chart in pixels. If this is not specified, the width is responsive. |
Data
Data can be one of two formats, an array of arrays or an array of objects. Both examples below will produce the same donut chart:
1. Array of arrays
Each entry in the dataset is an array. These arrays require a minimum of three items to denote the values, labels and color grouping.
For this data format, the valueAccessor, labelAccessor and colorAccessor are number indices, identified by the position within each array.
1
2const arrayData = [
  // in this example ['color', 'label', 'value']
  ['done', 'Done', 20],
  ['todo', 'To do', 10],
  ['inprogress', 'In progress', 5],
  ['blocked', 'Blocked', 5],
];

export const DonutChartWithArrayDataExample = () => {
  return <DonutChart
    data={arrayData}
    colorAccessor={0} // position 0 in item array
    labelAccessor={1} // position 1 in item array
    valueAccessor={2} // position 2 in item array
  />
};
2. Array of objects
Each entry in the dataset is an object. These objects require a minimum of three properties in the form of key-value pairs to denote the values, labels and color grouping.
For this data format, the valueAccessor, labelAccessor and colorAccessor are string indices, identified by the key of the key-value pairs.
1
2const objectData = [
  {
    type: 'done', // color grouping
    label: 'Done', // label
    value: 20, // value
  },
  {
    type: 'todo',
    label: 'To do',
    value: 10,
  },
  {
    type: 'inprogress',
    label: 'In progress',
    value: 5,
  },
  {
    type: 'blocked',
    label: 'Blocked',
    value: 5,
  },
];

export const DonutChartWithObjectDataExample = () => {
  return <DonutChart
    data={objectData}
    colorAccessor="type" // key of color value in object item
    labelAccessor="label" // key of label value in object item
    valueAccessor="value" // key for the value in object item
  />
};
Example app

Rate this page: