- ADF renderer
- Atlassian icon (Preview)
- Atlassian tile (Preview)
- Badge
- Bleed (Preview)
- Box
- Breadcrumbs (Preview)
- Button
- Button group
- Calendar
- Chart - Bar
- Chart - Donut
- Chart - Horizontal bar
- Chart - Horizontal stack bar
- Chart - Line
- Chart - Pie
- Chart - Stack bar
- Checkbox
- Checkbox group
- Code
- Code block
- Comment
- Comment editor
- Chromeless editor
- Date picker
- Dynamic table
- Empty state
- File card (Preview)
- File picker (Preview)
- Form
- Frame
- Heading
- Icon
- Image
- Inline
- Inline edit
- Link
- List
- Lozenge
- Modal
- Popup
- Pagination (Preview)
- Pressable
- Progress bar
- Progress tracker
- Radio
- Radio group
- Range
- Section message
- Select
- Spinner
- Stack
- Tabs
- Tag
- Tag group
- Text
- Text area
- Text field
- Time picker
- Tile (Preview)
- Toggle
- Tooltip
- User
- User group
- User picker
- XCSS
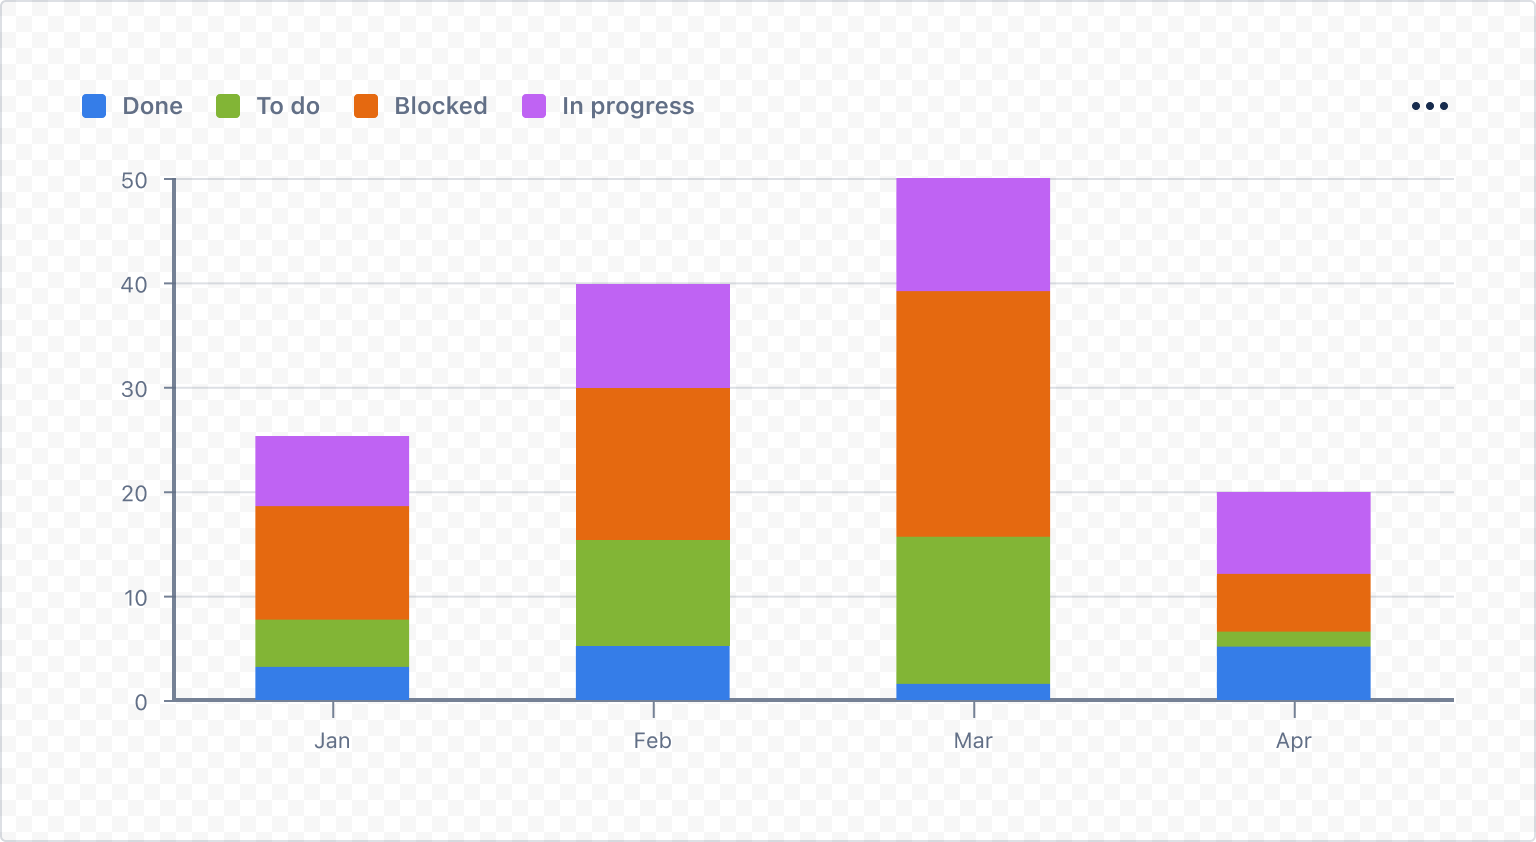
Stack bar chart
A visual representation of data using rectangular bars of varying heights to demonstrate comparisons between categories of data.
You must be on @forge/react major version 11.2.0 or higher to use the latest version of UI Kit components. To install:
1
2npm install --save @forge/react@latest
To add the StackBarChart component to your app:
1
2import { StackBarChart } from '@forge/react';
Props
| Name | Type | Required | Description |
|---|---|---|---|
colorAccessor | number | string | Yes | Accessor to define the color grouping. |
colorPalette | string[] | { key: string; value: string }[] | No | Custom color palette for the chart. Can be an array of color strings (e.g., ['#0052CC', '#FF5630']) or an array of objects with key and value properties to map specific data categories to colors (e.g., [{ key: 'category1', value: '#0052CC' }]). |
data | unknown[] | Yes | Data can be one of two formats:
|
height | number | No | The static height of the chart in pixels. Defaults to 400. |
subtitle | string | No | A string value that represents the subtitle of the chart. This appears below the title. |
title | string | No | A string value that represents the title of the chart. |
width | number | No | The static width of the chart in pixels. If this is not specified, the width is responsive. |
xAccessor | number | string | Yes | Accessor to define the x-axis values. This can be a numerical or string index. For more information on all accessors, see Data. |
yAccessor | number | string | Yes | Accessor to define the y-axis values. |
Data
Data can be one of two formats, an array of arrays or an array of objects. Both examples below will produce the same stack bar chart:
1. Array of arrays
Each entry in the dataset is an array. These arrays require three items to denote the x and y coordinates and to indicate color grouping.
For this data format, the xAccessor, yAccessor and colorAccessor are number indices, identified by the position within each array.
1
2const arrayData = [
  // in this example ['x value', 'y value', 'color value']
  ["Jan", 4, "Done"],
  ["Jan", 5, "To do"],
  ["Jan", 10, "Blocked"],
  ["Jan", 6, "In progress"],
  ["Feb", 5, "Done"],
  ["Feb", 10, "To do"],
  ["Feb", 15, "Blocked"],
  ["Feb", 10, "In progress"],
  ["Mar", 1, "Done"],
  ["Mar", 14, "To do"],
  ["Mar", 25, "Blocked"],
  ["Mar", 10, "In progress"],
  ["Apr", 5, "Done"],
  ["Apr", 2, "To do"],
  ["Apr", 5, "Blocked"],
  ["Apr", 8, "In progress"],
]

export const StackBarChartWithArrayDataExample = () => {
  return <StackBarChart
    data={arrayData}
    xAccessor={0} // position 0 in item array
    yAccessor={1} // position 1 in item array
    colorAccessor={2} // position 2 in item array
  />;
};
2. Array of objects
Each entry in the dataset is an object. These objects require three properties in the form of key-value pairs to denote the x and y coordinates and to indicate color grouping.
For this data format, the xAccessor, yAccessor and colorAccessor are string indices, identified by the key of the key-value pairs.
1
2const objectData = [
  {
    xAxis: 'Jan', // x value
    value: 4, // y value
    status: 'Done', // color value
  },
  {
    xAxis: 'Jan',
    value: 5,
    status: 'To do',
  },
  {
    xAxis: 'Jan',
    value: 10,
    status: 'Blocked',
  },
  {
    xAxis: 'Jan',
    value: 6,
    status: 'In progress',
  },
  {
    xAxis: 'Feb',
    value: 5,
    status: 'Done',
  },
  {
    xAxis: 'Feb',
    value: 10,
    status: 'To do',
  },
  {
    xAxis: 'Feb',
    value: 15,
    status: 'Blocked',
  },
  {
    xAxis: 'Feb',
    value: 10,
    status: 'In progress',
  },
  {
    xAxis: 'Mar',
    value: 1,
    status: 'Done',
  },
  {
    xAxis: 'Mar',
    value: 14,
    status: 'To do',
  },
  {
    xAxis: 'Mar',
    value: 25,
    status: 'Blocked',
  },
  {
    xAxis: 'Mar',
    value: 10,
    status: 'In progress',
  },
  {
    xAxis: 'Apr',
    value: 5,
    status: 'Done',
  },
  {
    xAxis: 'Apr',
    value: 2,
    status: 'To do',
  },
  {
    xAxis: 'Apr',
    value: 5,
    status: 'Blocked',
  },
  {
    xAxis: 'Apr',
    value: 8,
    status: 'In progress',
  },
];
export const StackBarChartWithObjectDataExample = () => {
  return <StackBarChart
    data={objectData}
    xAccessor={"xAxis"} // key of x value in object item
    yAccessor={"value"} // key of y value in object item
    colorAccessor={"status"} // key of color value in object item
  />;
};
Example app

Rate this page: