Debug functions using IntelliJ
Interactive debuggers are useful tools that help identify and fix issues or bugs within your code. You can execute your code line by line, examining the values of variables and the program's state at each step.
This tutorial demonstrates the use of the interactive debugger in IntelliJ to debug your back-end code in Forge functions and resolvers (for apps running on the NodeJS runtime).
Before you begin
This tutorial assumes you're already familiar with the basics of Forge development. If this is your first time using Forge, see Getting started first.
The debugging procedure in this tutorial is only supported on the NodeJS runtime. If your app uses the legacy runtime, we strongly recommend that you migrate to the NodeJS runtime.
In addition, you’ll also need to install version 9.2.0 (or higher) of the Forge CLI.
Set up a new configuration
-
Start the Forge tunnel using the additional debug options. For example:
1 2
forge tunnel --debug --debugFunctionHandlers index.handler --debugStartingPort 9229Replace
index.handlerwith the function/s you want to debug. -
If you’re successful you should see a message saying the debugger is listening on the port specified and the tunnel is listening for requests.
1 2
✔ Resources bundled. Listening for requests... Debugger listening on ws://0.0.0.0:9229/8d29c246-2186-4e20-9851-4aa609a3b890 For help, see: https://nodejs.org/en/docs/inspector -
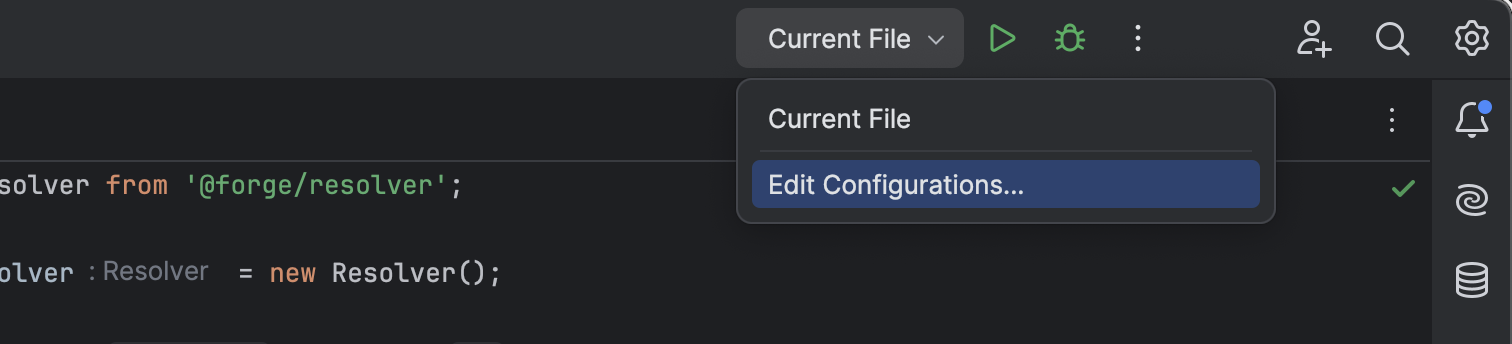
With your Forge app open in ItelliJ click on Current File and Edit Configurations.
-
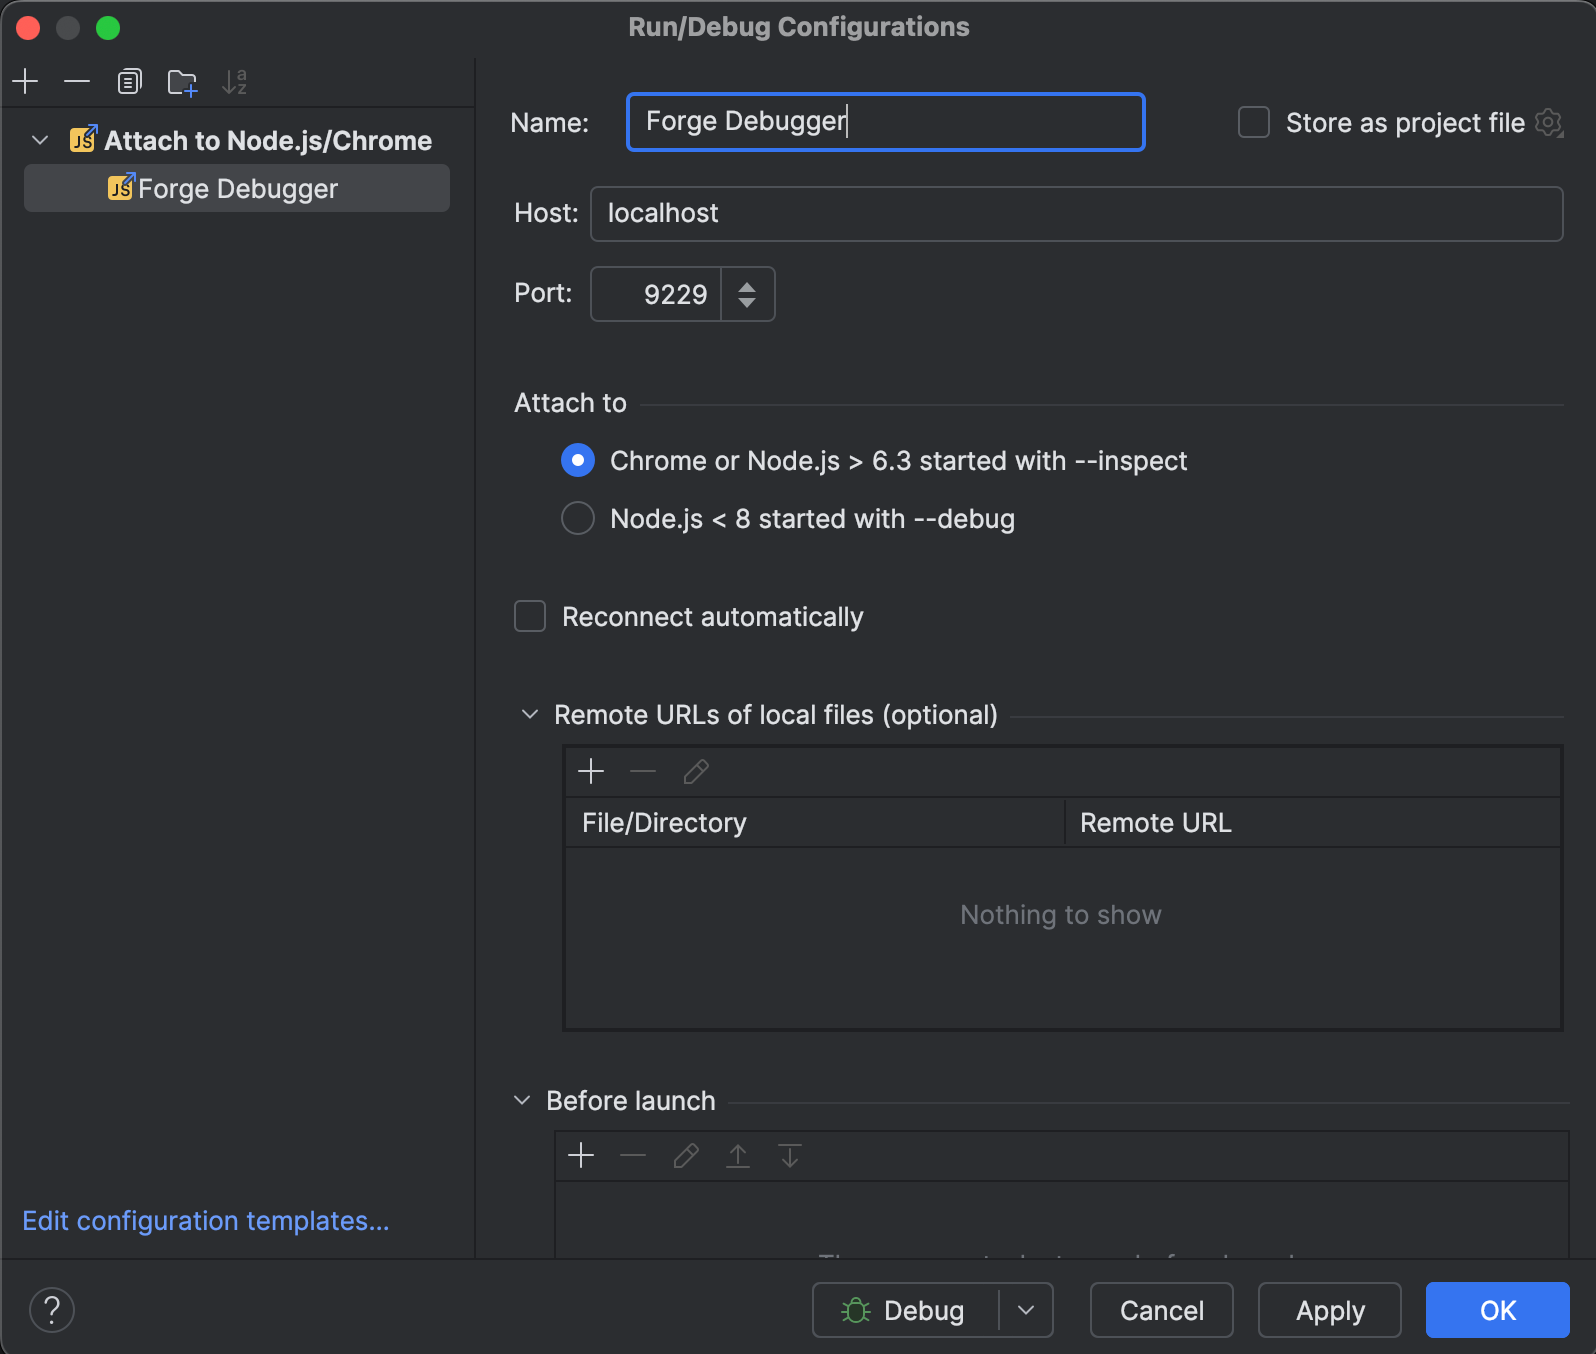
Click on Add new run configuration and Attach to Node.JS/Chrome.
-
Give the configuration a new name (for example, Forge Debugger), and make sure the port matches the port from your CLI command (for example, 9229).
-
Click OK.
Add a breakpoint and start debugging
-
Add a breakpoint to your code by clicking on a line number.
-
Run the debugger by clicking the bug icon in the top right of the screen.

-
Refresh your Forge app in the web browser and the code will stop executing at the breakpoint. Here you can check the value of your variables and step through your code.
Rate this page: