Remote observability
Options for error metrics, logs, and tracing are available for Forge Remote.
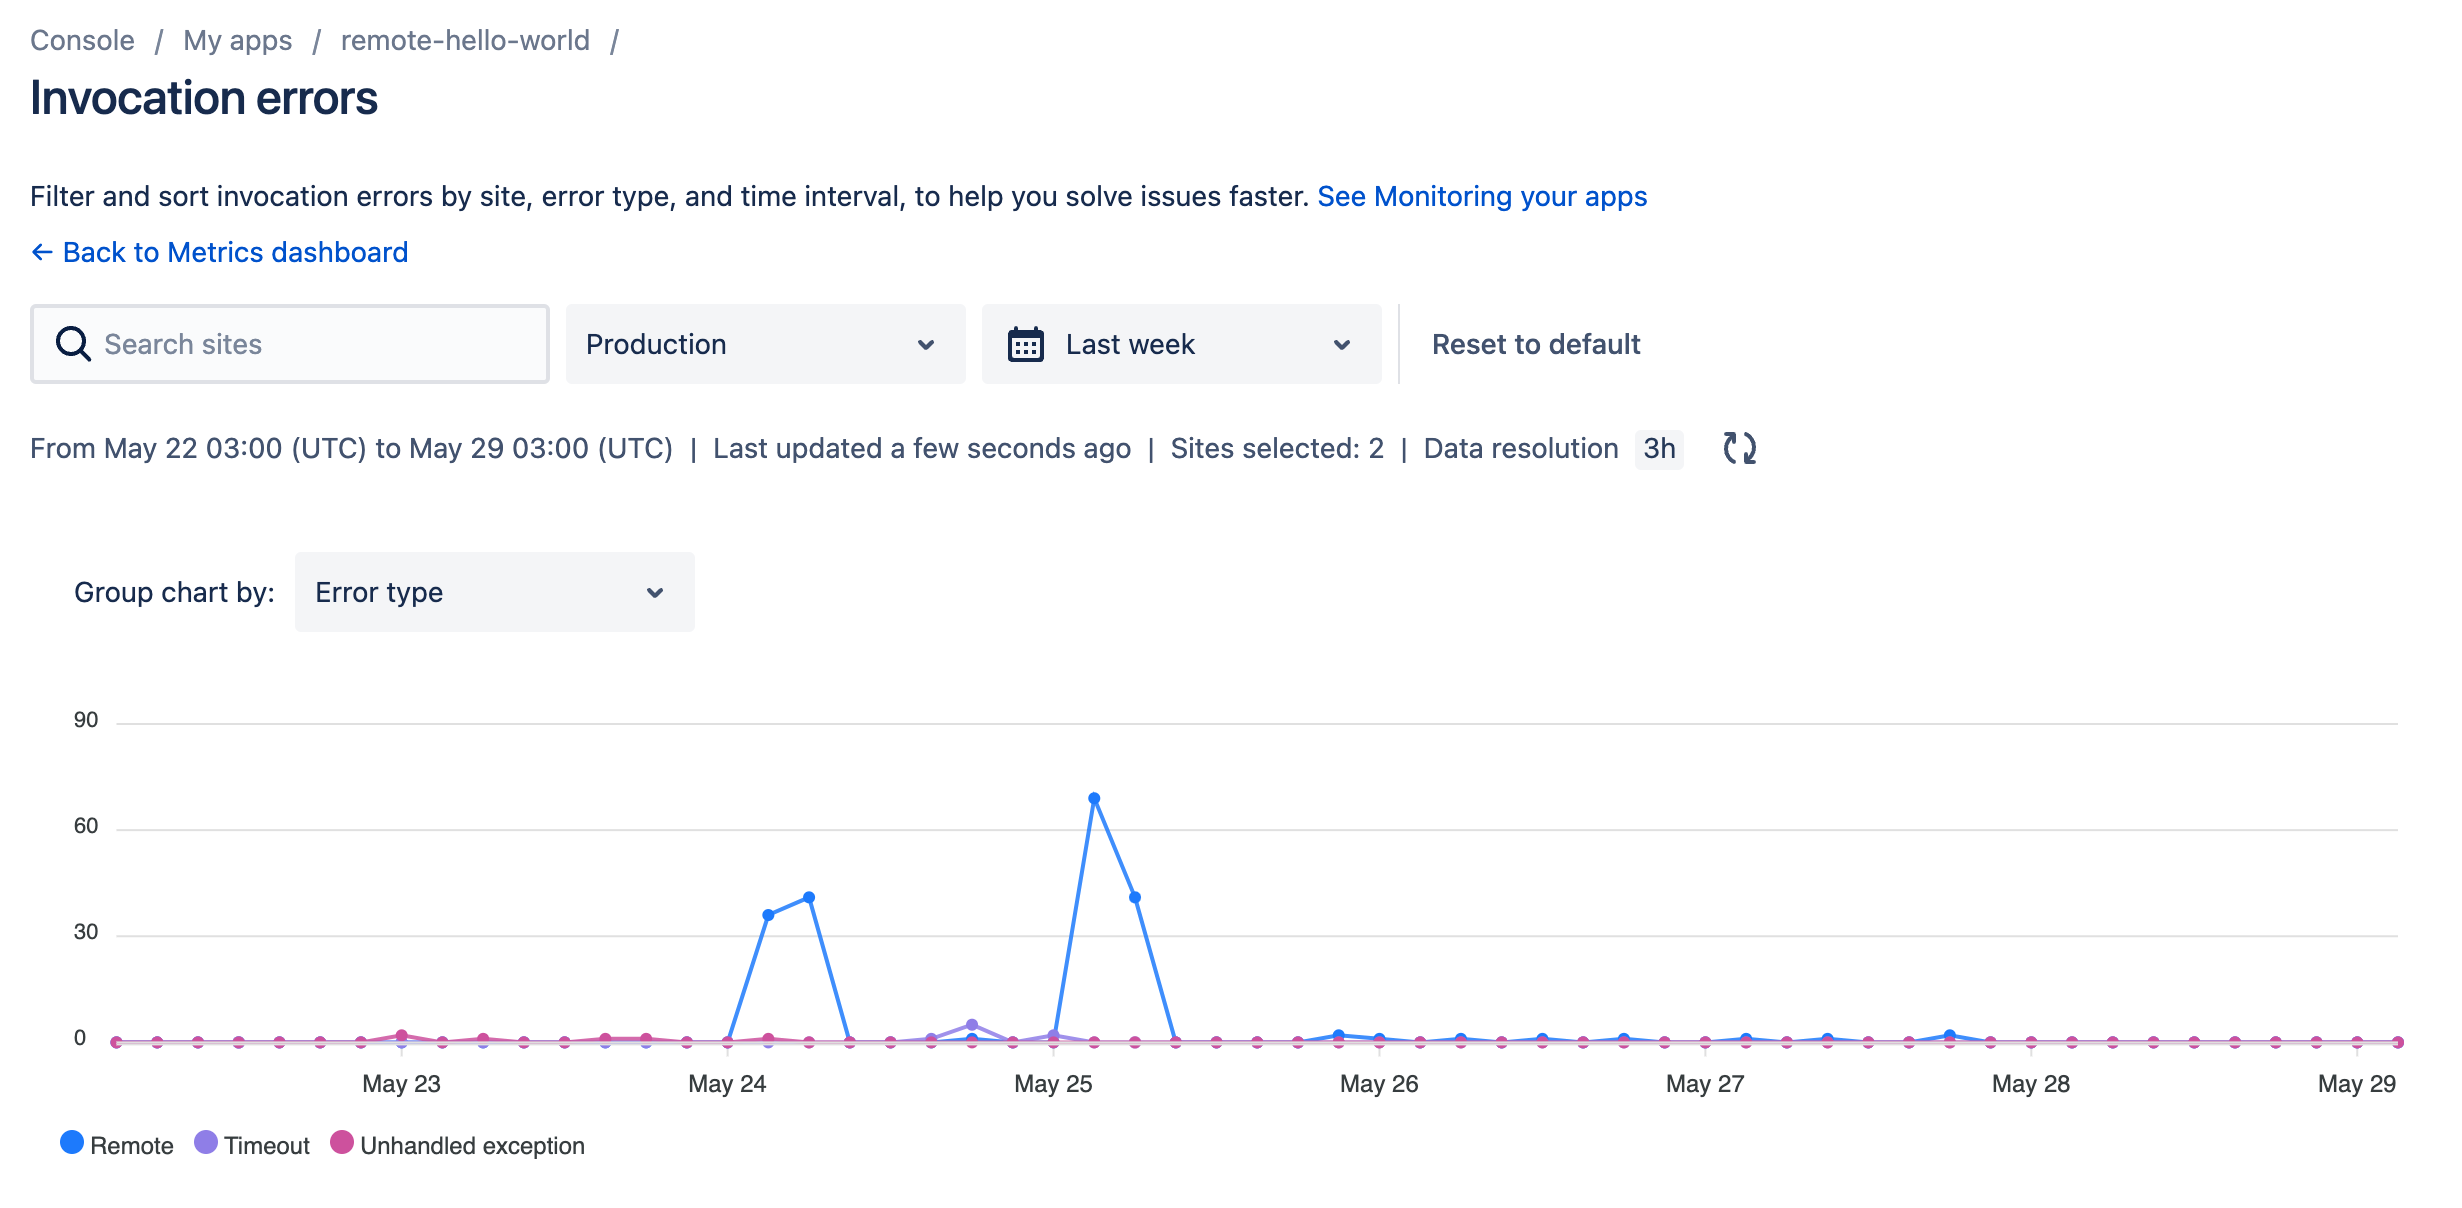
Metrics
Metrics on remote invocations and errors encountered are available in the developer console.
The Remote error type shows the count of remote invocation errors.
Exporting app metrics
Use the App metrics API to export app metrics to observability tools, including Splunk, Datadog, and more.
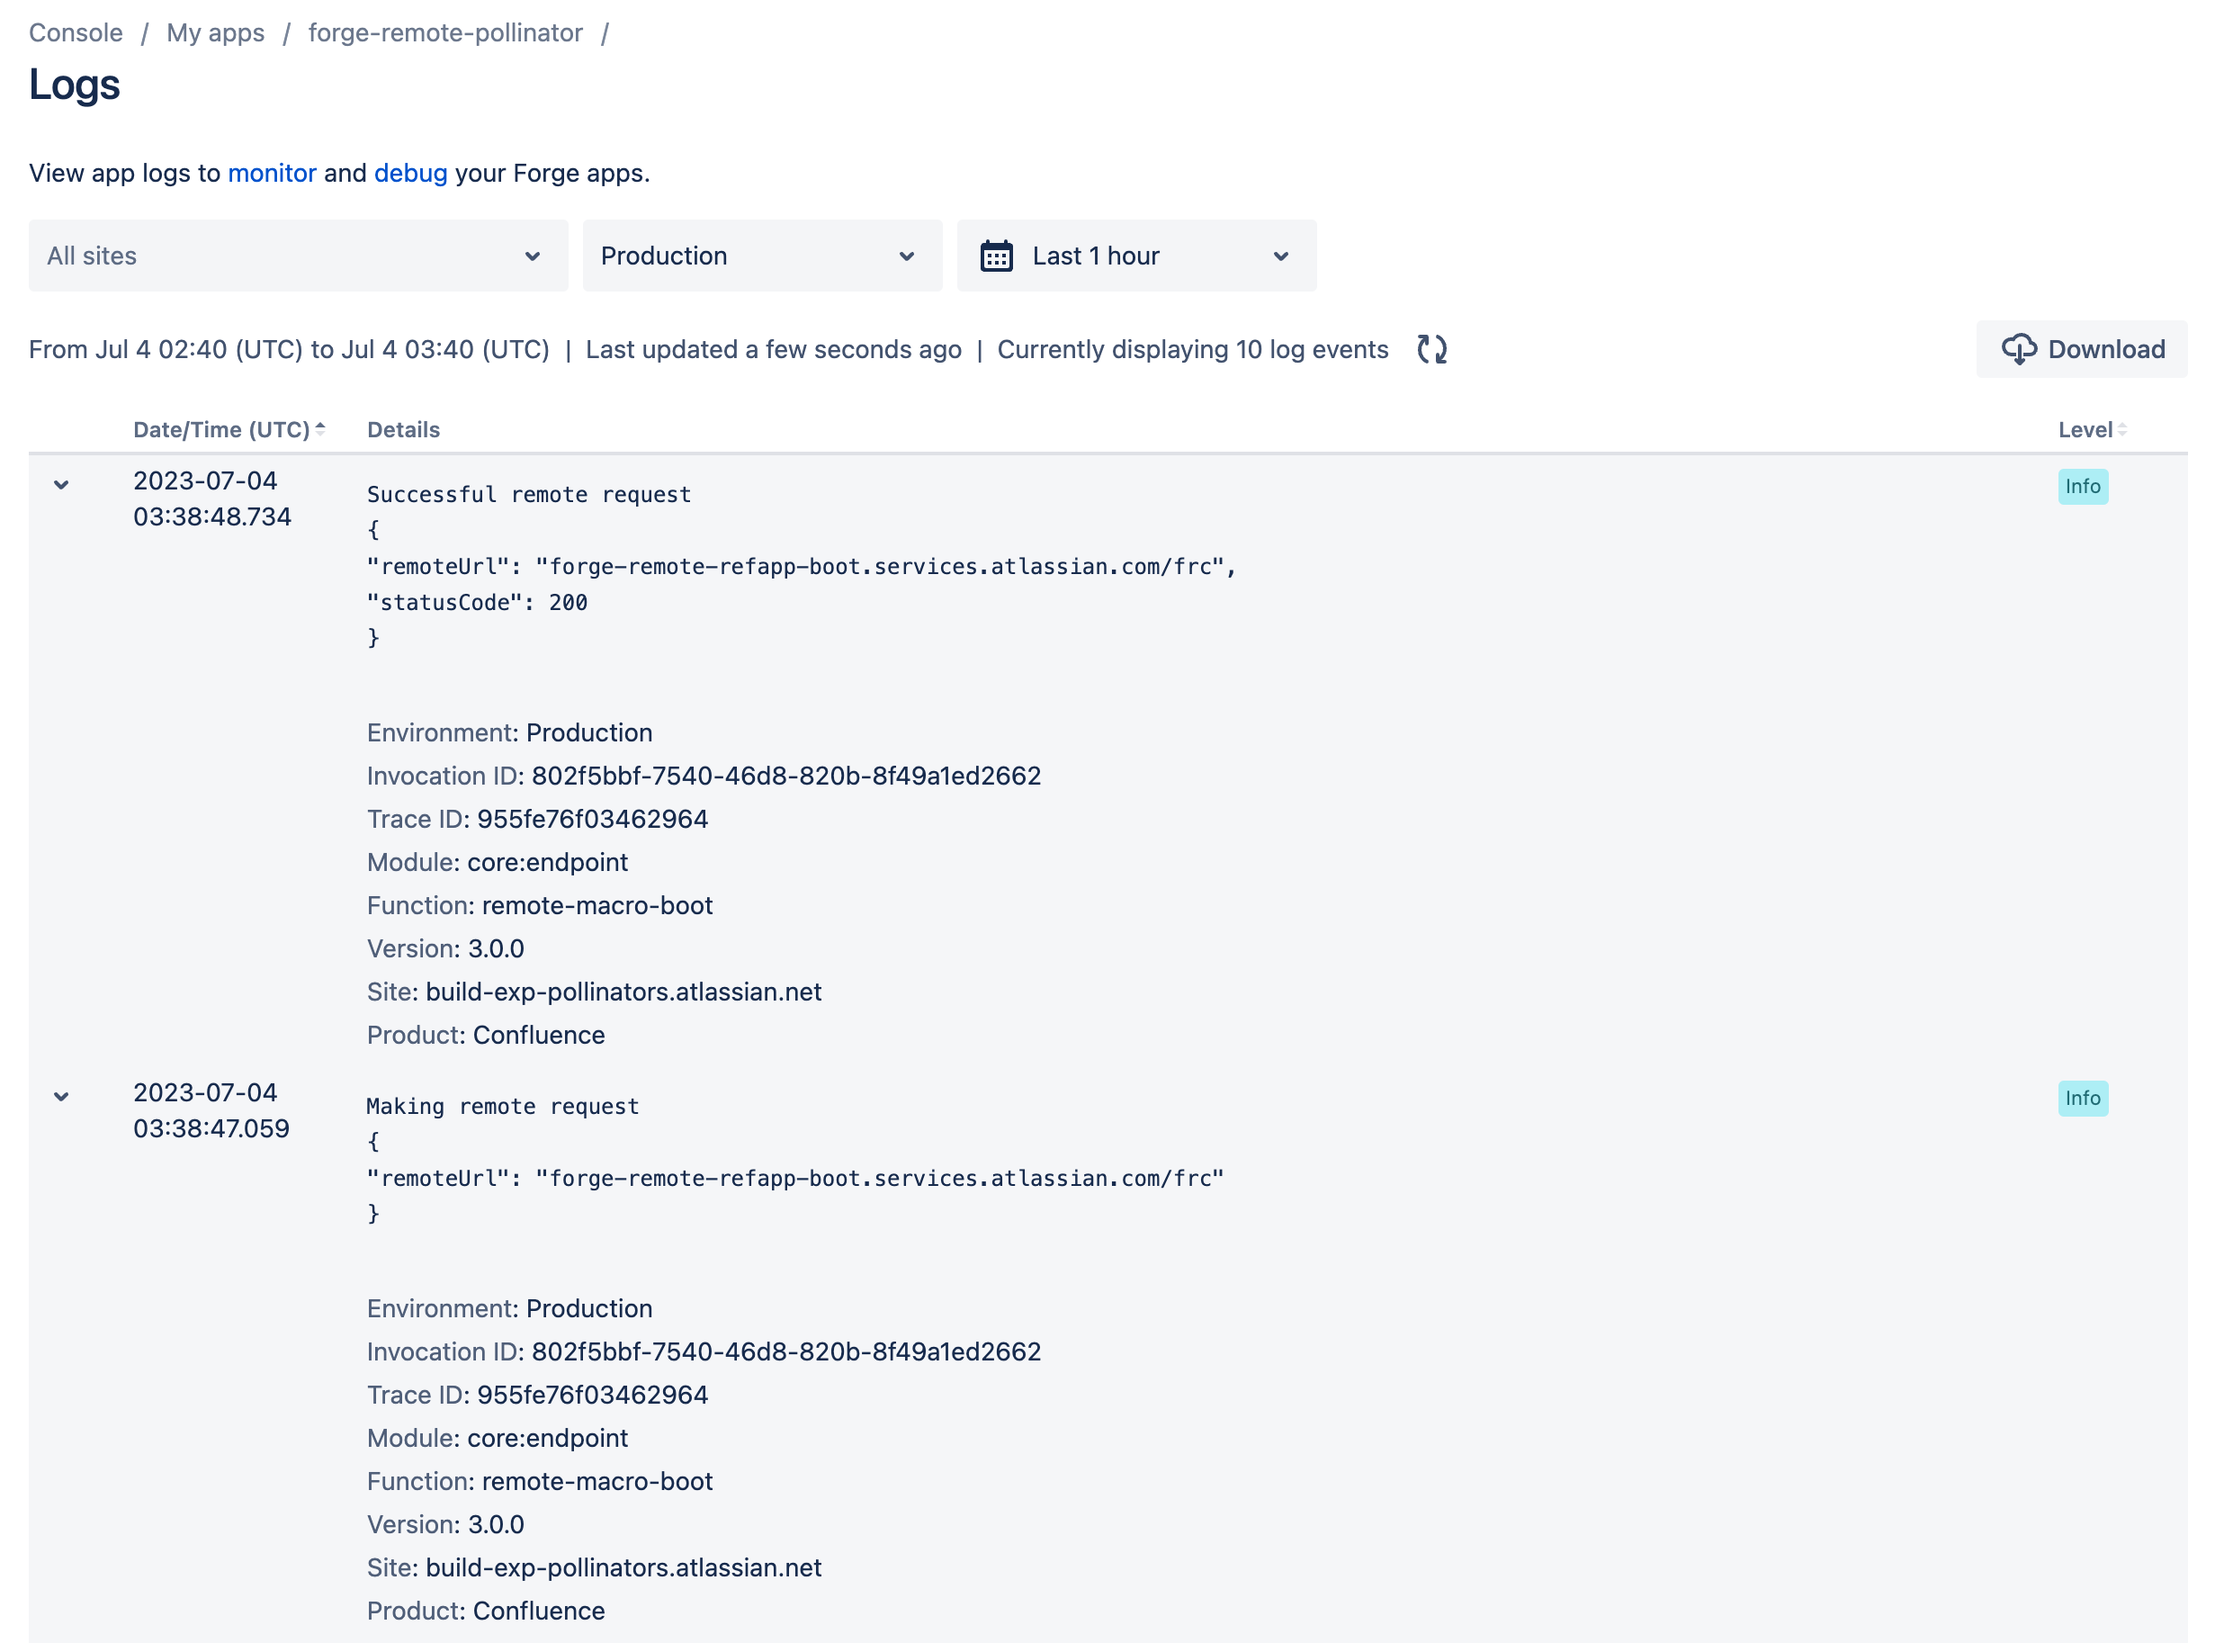
Logs
Remote invocations are included in the Forge logs in the developer console and the CLI.
Exporting app logs
Use the App logs API to export app logs to observability tools, including Splunk, Datadog, Dynatrace, New Relic, and more.
Tracing
To help with diagnosing issues Atlassian will provide the following trace headers as part of each request as well as part of the invocation body. If you provide this traceId in any support correspondence with Atlassian this should help speed up the resolution of any issues.
You can also optionally join this trace on the remote endpoint side and propagate these values onto any Atlassian app and platform APIs you need to call.
| Header | Explanation |
|---|---|
x-b3-traceid | The TraceId is 64 or 128-bit in length and indicates the overall ID of the trace. Every span in a trace shares this ID. |
x-b3-spanid | The SpanId is 64-bit in length and indicates the position of the current operation in the trace tree. The value should not be interpreted: it may or may not be derived from the value of the TraceId. |
Rate this page: