Debug functions using VS Code
Interactive debuggers are useful tools that help identify and fix issues or bugs within your code. You can execute your code line by line, examining the values of variables and the program's state at each step.
This tutorial demonstrates the use of the interactive debugger in VSCode to debug your back-end code in Forge functions and resolvers (for apps running on the NodeJS runtime).
Before you begin
This tutorial assumes you're already familiar with the basics of Forge development. If this is your first time using Forge, see Getting started first.
The debugging procedure in this tutorial is only supported on the NodeJS runtime. If your app uses the legacy runtime, we strongly recommend that you migrate to the NodeJS runtime.
In addition, you’ll also need to install version 9.2.0 (or higher) of the Forge CLI.
Create a launch configuration file
To get started, you need to create a launch configuration file in your Forge project. Detailed VS Code instructions are available here.
-
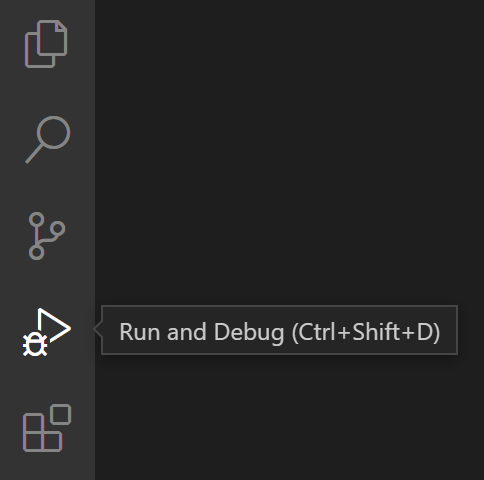
Open your Forge app project in VS Code, then open the Run and Debug view from the activity sidebar.
-
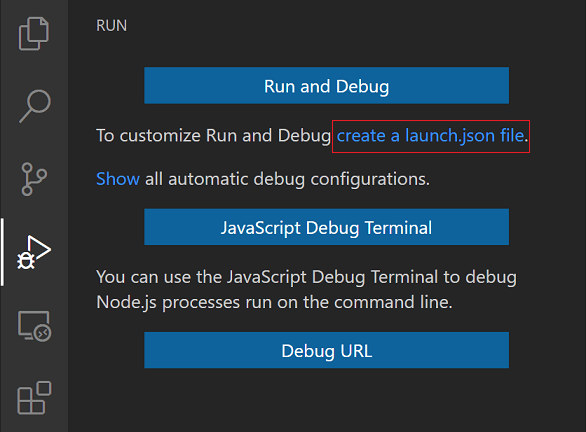
Click on create a launch.json file.
-
Select Node.js as your debug environment. This will create a
launch.jsonfile in a.vscodefolder in your base directory.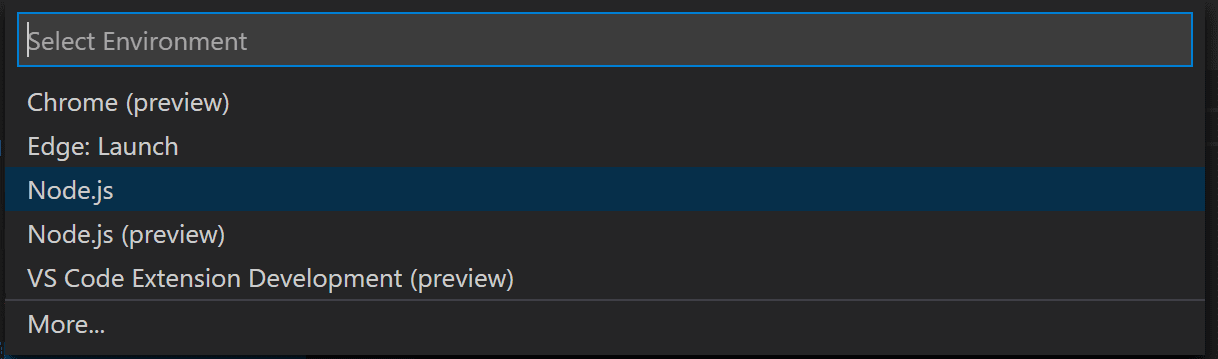
-
Replace the contents of the launch.json with the following example:
You can change the
portto whichever port you'd prefer to use but you must include"sourceMaps": true.1 2
{ // Use IntelliSense to learn about possible attributes. // Hover to view descriptions of existing attributes. // For more information, visit: https://go.microsoft.com/fwlink/?linkid=830387 "version": "0.2.0", "configurations": [ { "name": "Attach Forge App Debugger", "port": 9229, "request": "attach", "type": "node", "sourceMaps": true } ] }
Start debugging
Start debugging your Forge app by starting the Forge tunnel using the additional debug options.
-
Replace the
index.handlerwith the function/s you want to debug and make sure the port number matches the one you specified in yourlaunch.jsonfile.For example:
1 2
forge tunnel --debug --debugFunctionHandlers index.handler --debugStartingPort 9229When you run the tunnel with the debug option, Forge will generate the bundle codes under
.forgefolder. You should add.forgeto the git ignore list. -
You should see a message saying the debugger is listening on the port specified and the tunnel is listening for requests:
1 2
✔ Resources bundled. Listening for requests... Debugger listening on ws://0.0.0.0:9229/8d29c246-2186-4e20-9851-4aa609a3b890 For help, see: https://nodejs.org/en/docs/inspector -
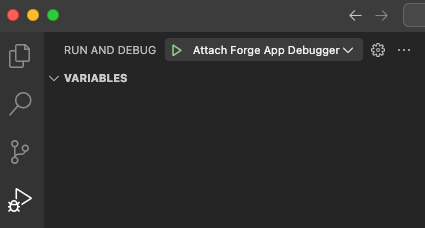
Click on the play button in the Run and Debug panel to start debugging.
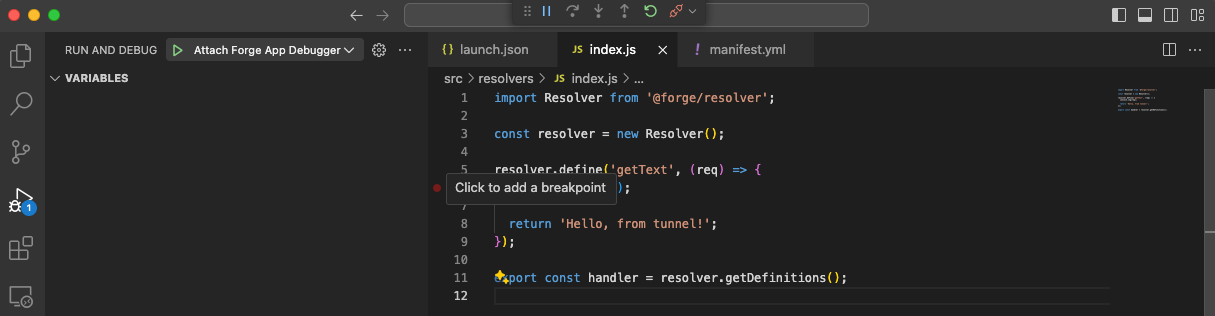
Add a breakpoint
-
Add a breakpoint to a line of code where you want the execution to pause. This will allow you to check things like variables and application state.
-
Refresh the page where your Forge app is rendered so that the function is invoked. It will now pause at the breakpoint.
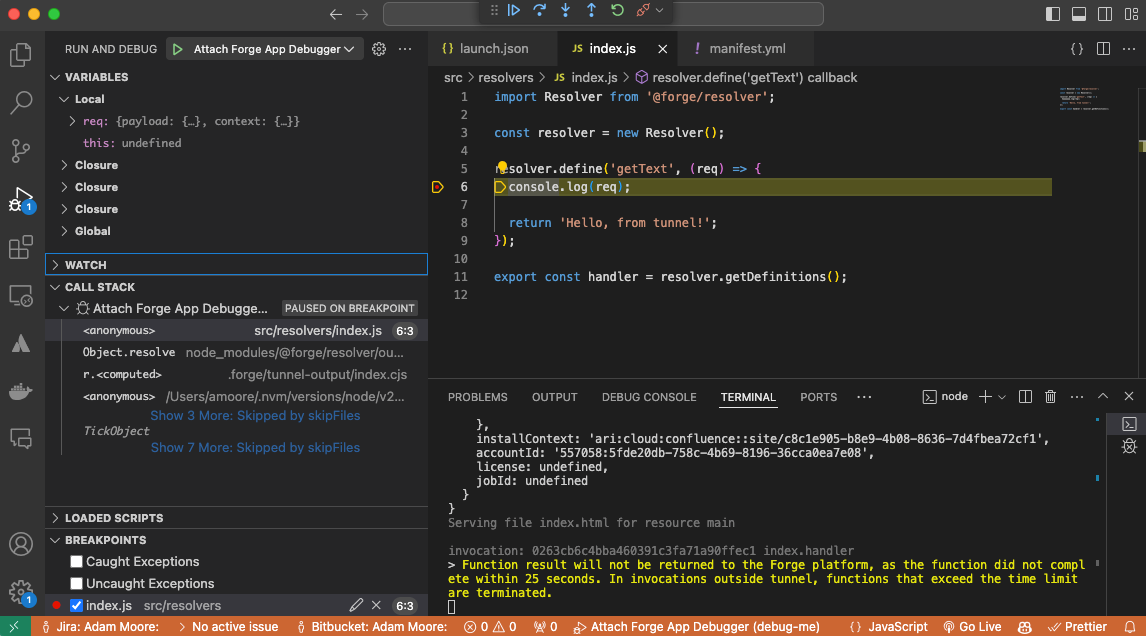
-
Here you can check the values of different variables like the
contextobject: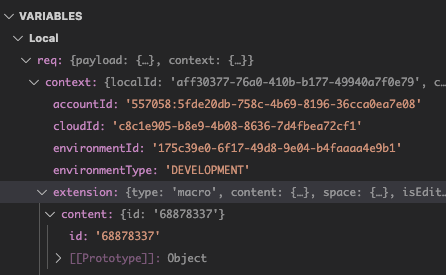
-
Continue stepping through the function when ready.
Rate this page: