Monitor custom metrics
Custom metrics allow you to track specific events, actions, and measurements within your Forge app. This enables you to monitor business-specific KPIs and instrument critical paths within your app code.
Only users with admin role can register, edit, and delete custom metrics.
To view custom metrics:
-
Access the developer console.
-
Select the Forge app that you want to view metrics for.
-
Select Metrics in the left menu.
-
Select Custom in the left menu.
Register a custom metric
You can register up to 20 custom metrics per app. Only counter-type metrics are currently supported. Additional metric types may be added in future releases.
To start using custom metrics for your app, you need to register them in the developer console.
To register a custom metric:
-
Select Custom in the left menu under Metrics.
-
Click Register metric.
-
Enter a name and description for your metric. For example,
jira-actions-success. -
Select Register.
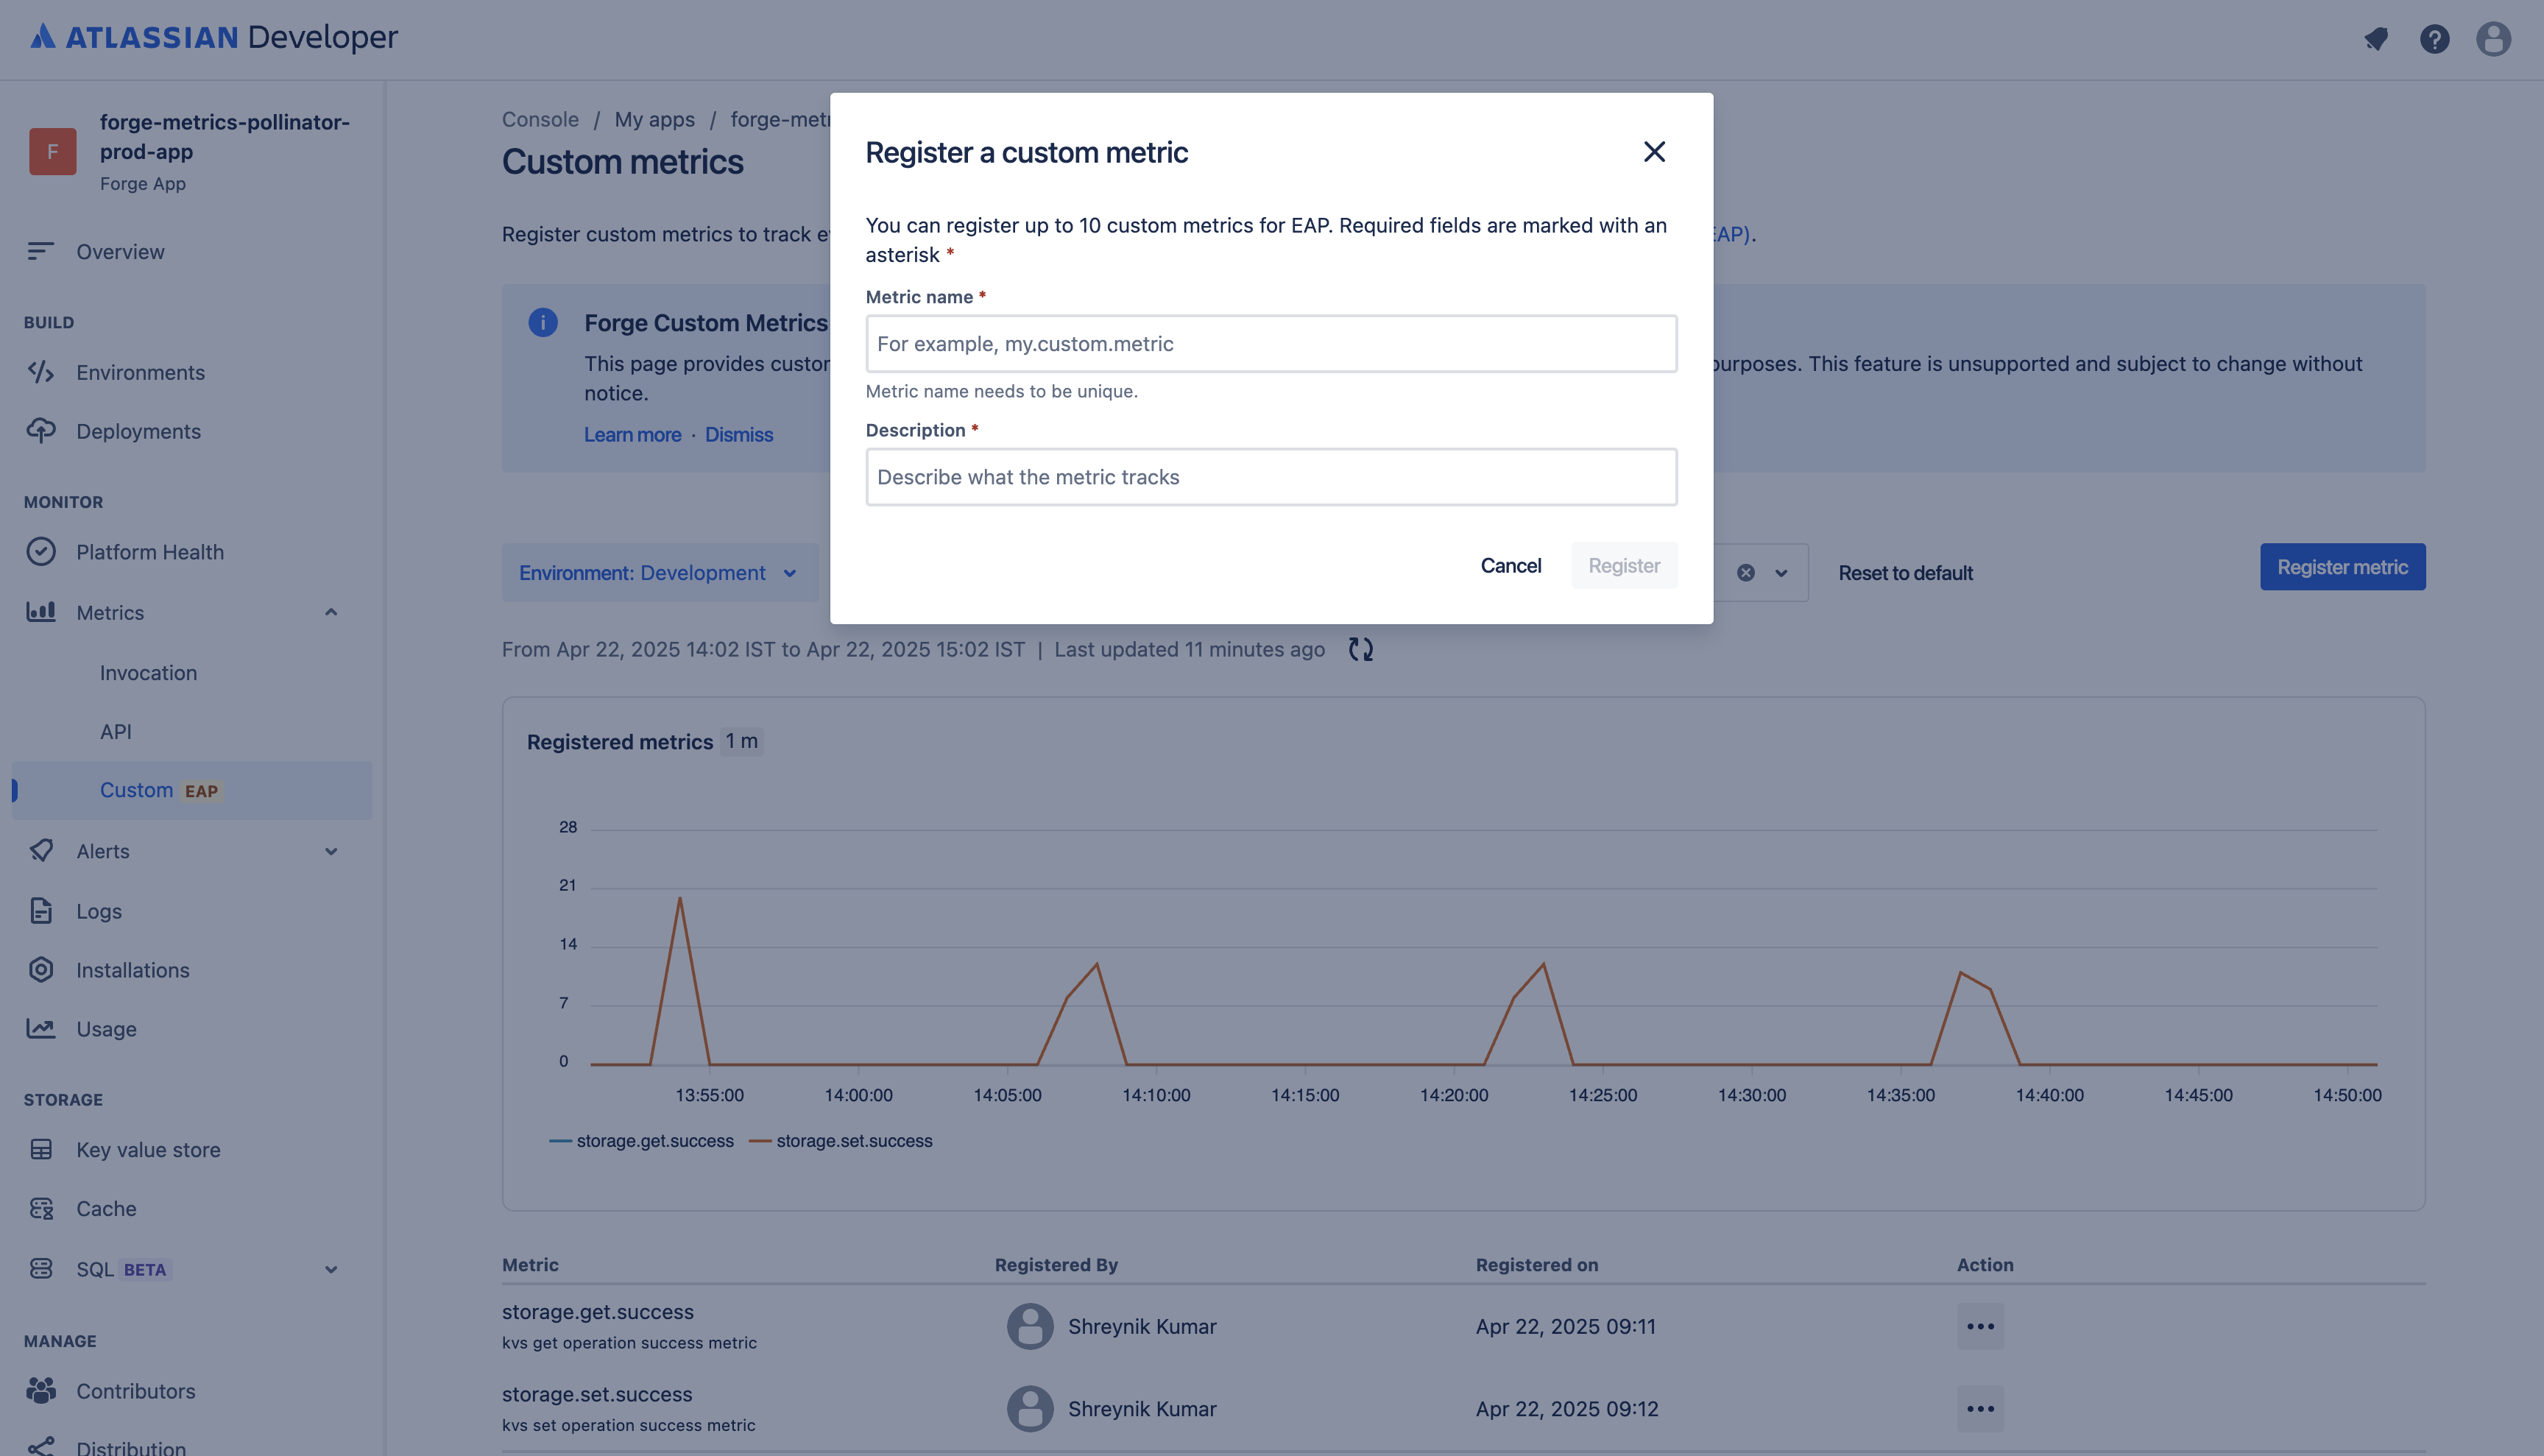
After a custom metric is registered, it may take up to 15 minutes before the metric is ingested into the system.
Instrument a custom metric
Before proceeding further, ensure you have registered the custom metric for your app already.
-
Install the Forge metrics package by running this command in your terminal:
1 2
npm install @forge/metrics -
Use the metrics package installed above in your app code:
1 2
import { internalMetrics } from '@forge/metrics'; -
Implement the custom metrics logic in your code. For example:
1 2
export const run = async (payload, context) => { const counter = internalMetrics.counter('jira-actions-success'); // Name should exactly match as registered in developer console const jiraIssues = await fetch(...); counter.incr(); // Increment by 1 // Or increment by a specific value counter.incrBy(value); for (const issue of jiraIssues) { .... } };The metric name in your app code must match the metric name registered in the developer console.
-
Deploy your app using the Forge CLI by running:
1 2
forge deploy -
View the instrumented custom metric in the developer console.
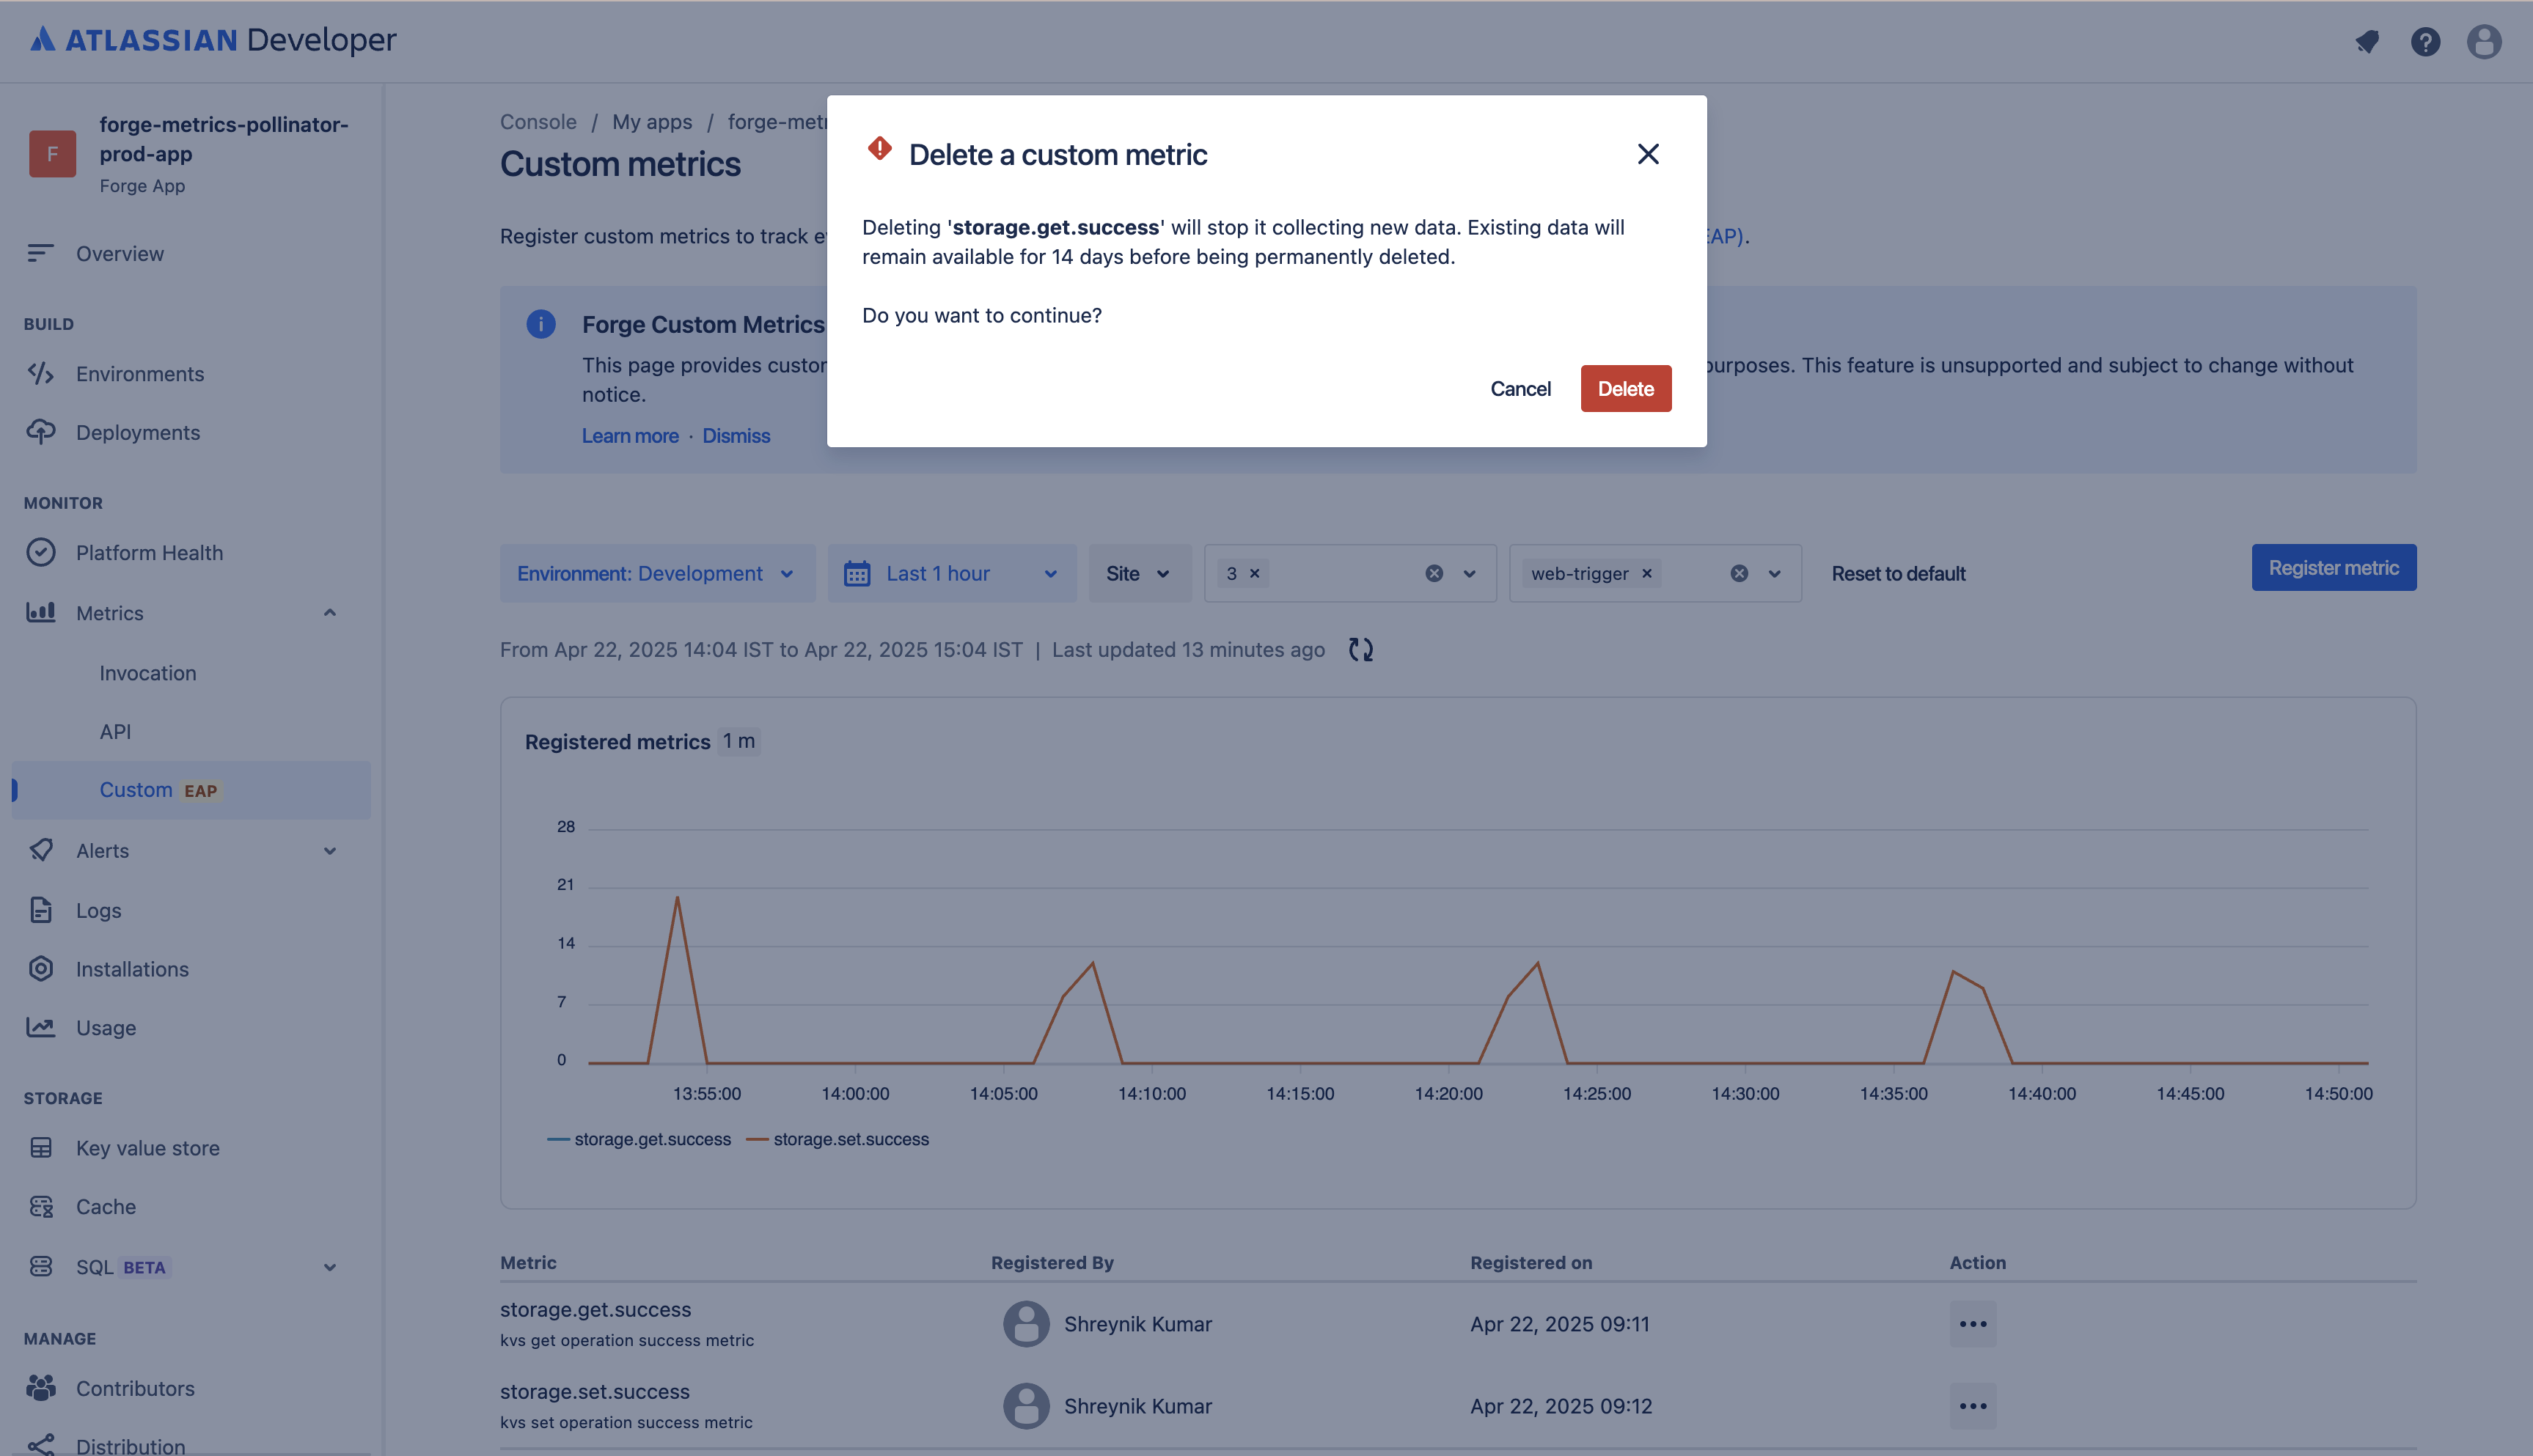
Delete a custom metric
Once deleted, custom metric ingestion will be stopped immediately. However, you will still have access to historical data up to 14 days in the past.
To delete a custom metric:
- Click the options menu next to the metric you want to delete.
- Select Delete in the menu.
- Select Delete in the confirmation dialog to confirm.
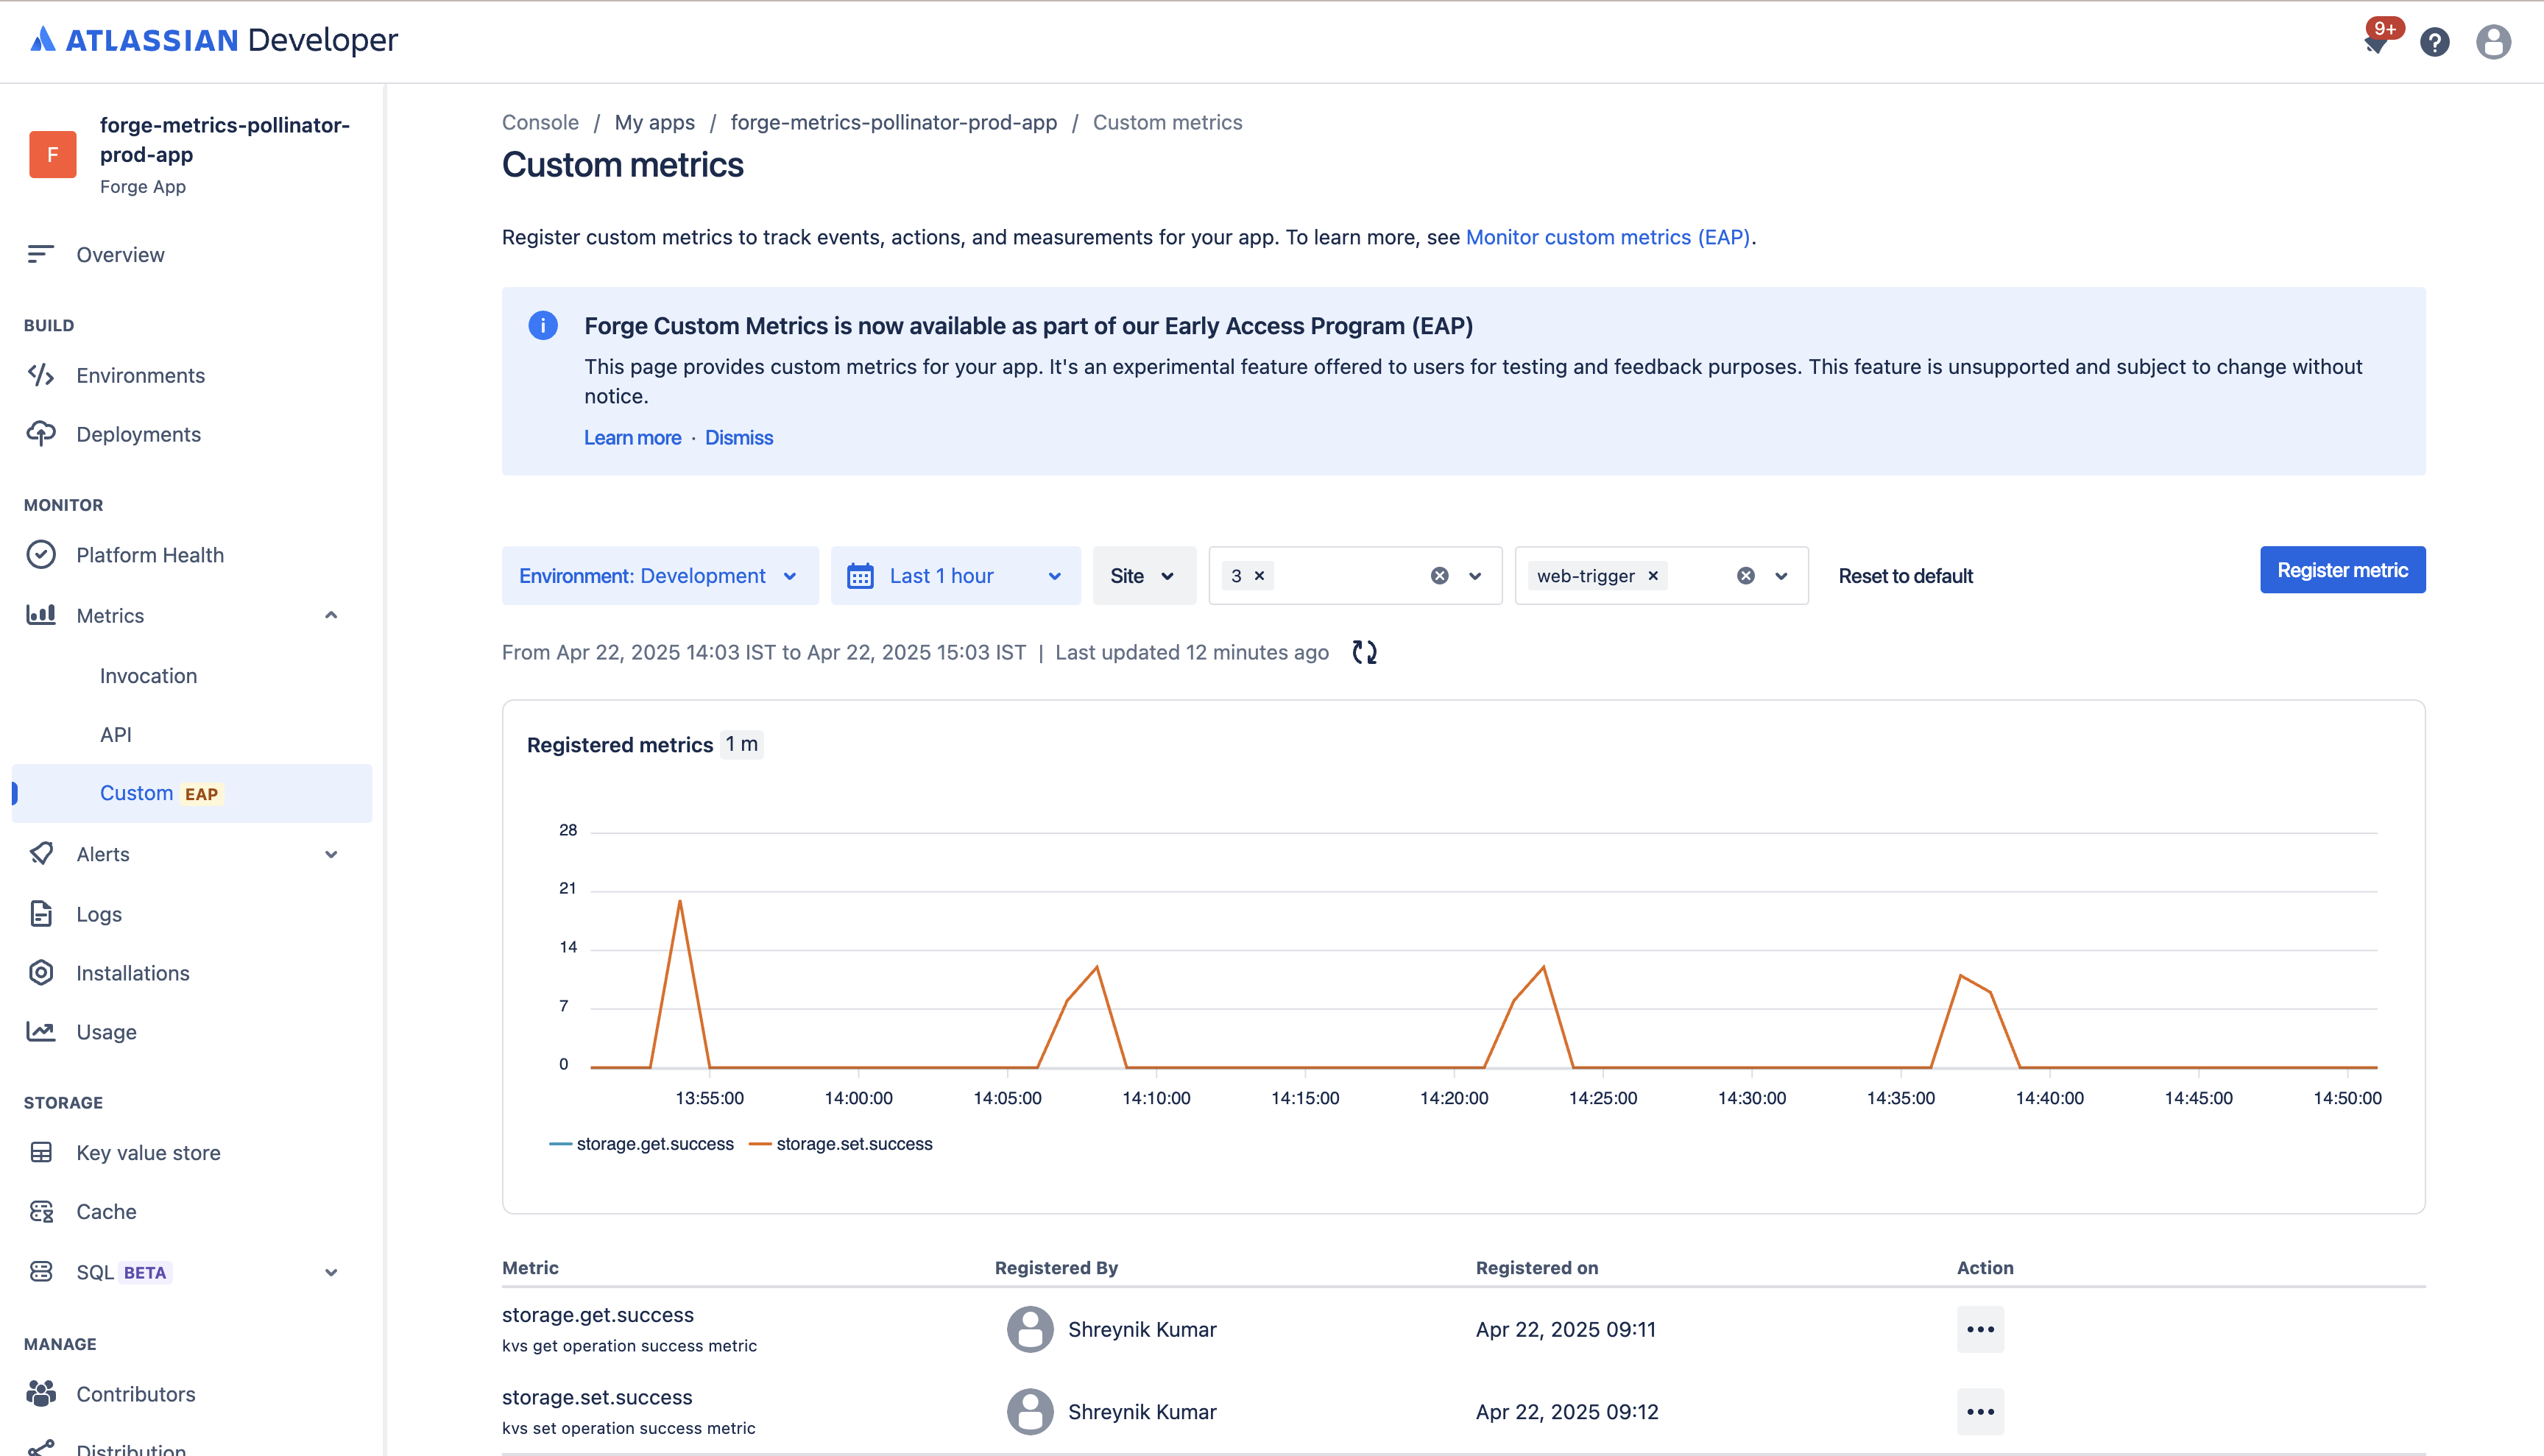
Filters
Use these filters to refine your metrics:
-
Environment: Narrows down the metrics for a specific app environment for your app.
-
Date: Narrows down the metrics based on your chosen time interval. Choose from a range of predefined values, such as the Last 24 hours, or choose a more specific time interval using the Custom option.
-
Sites: Narrows down the metrics based on the sites that your app is installed onto, for example,
<your-site>.atlassian.net. You can select multiple sites. -
Major App Versions: Narrows down the metrics based on the major version of your app.
-
Function names: Narrows down the metrics based on the function name from where the custom metric is emitted.
- Metrics are only shown for sites with at least one invocation in the past 14 days.
- All dates are in Coordinated Universal Time (UTC).
- Each chart's data resolution depends on the time interval you've selected. For example 'Last 24 hours' shows data at a 30-minute resolution, and 'Last hour' shows data at a 1-minute resolution.
- Metrics may not always be accurate because undelivered metrics data isn't back-filled and data sampling might be used for some metrics.
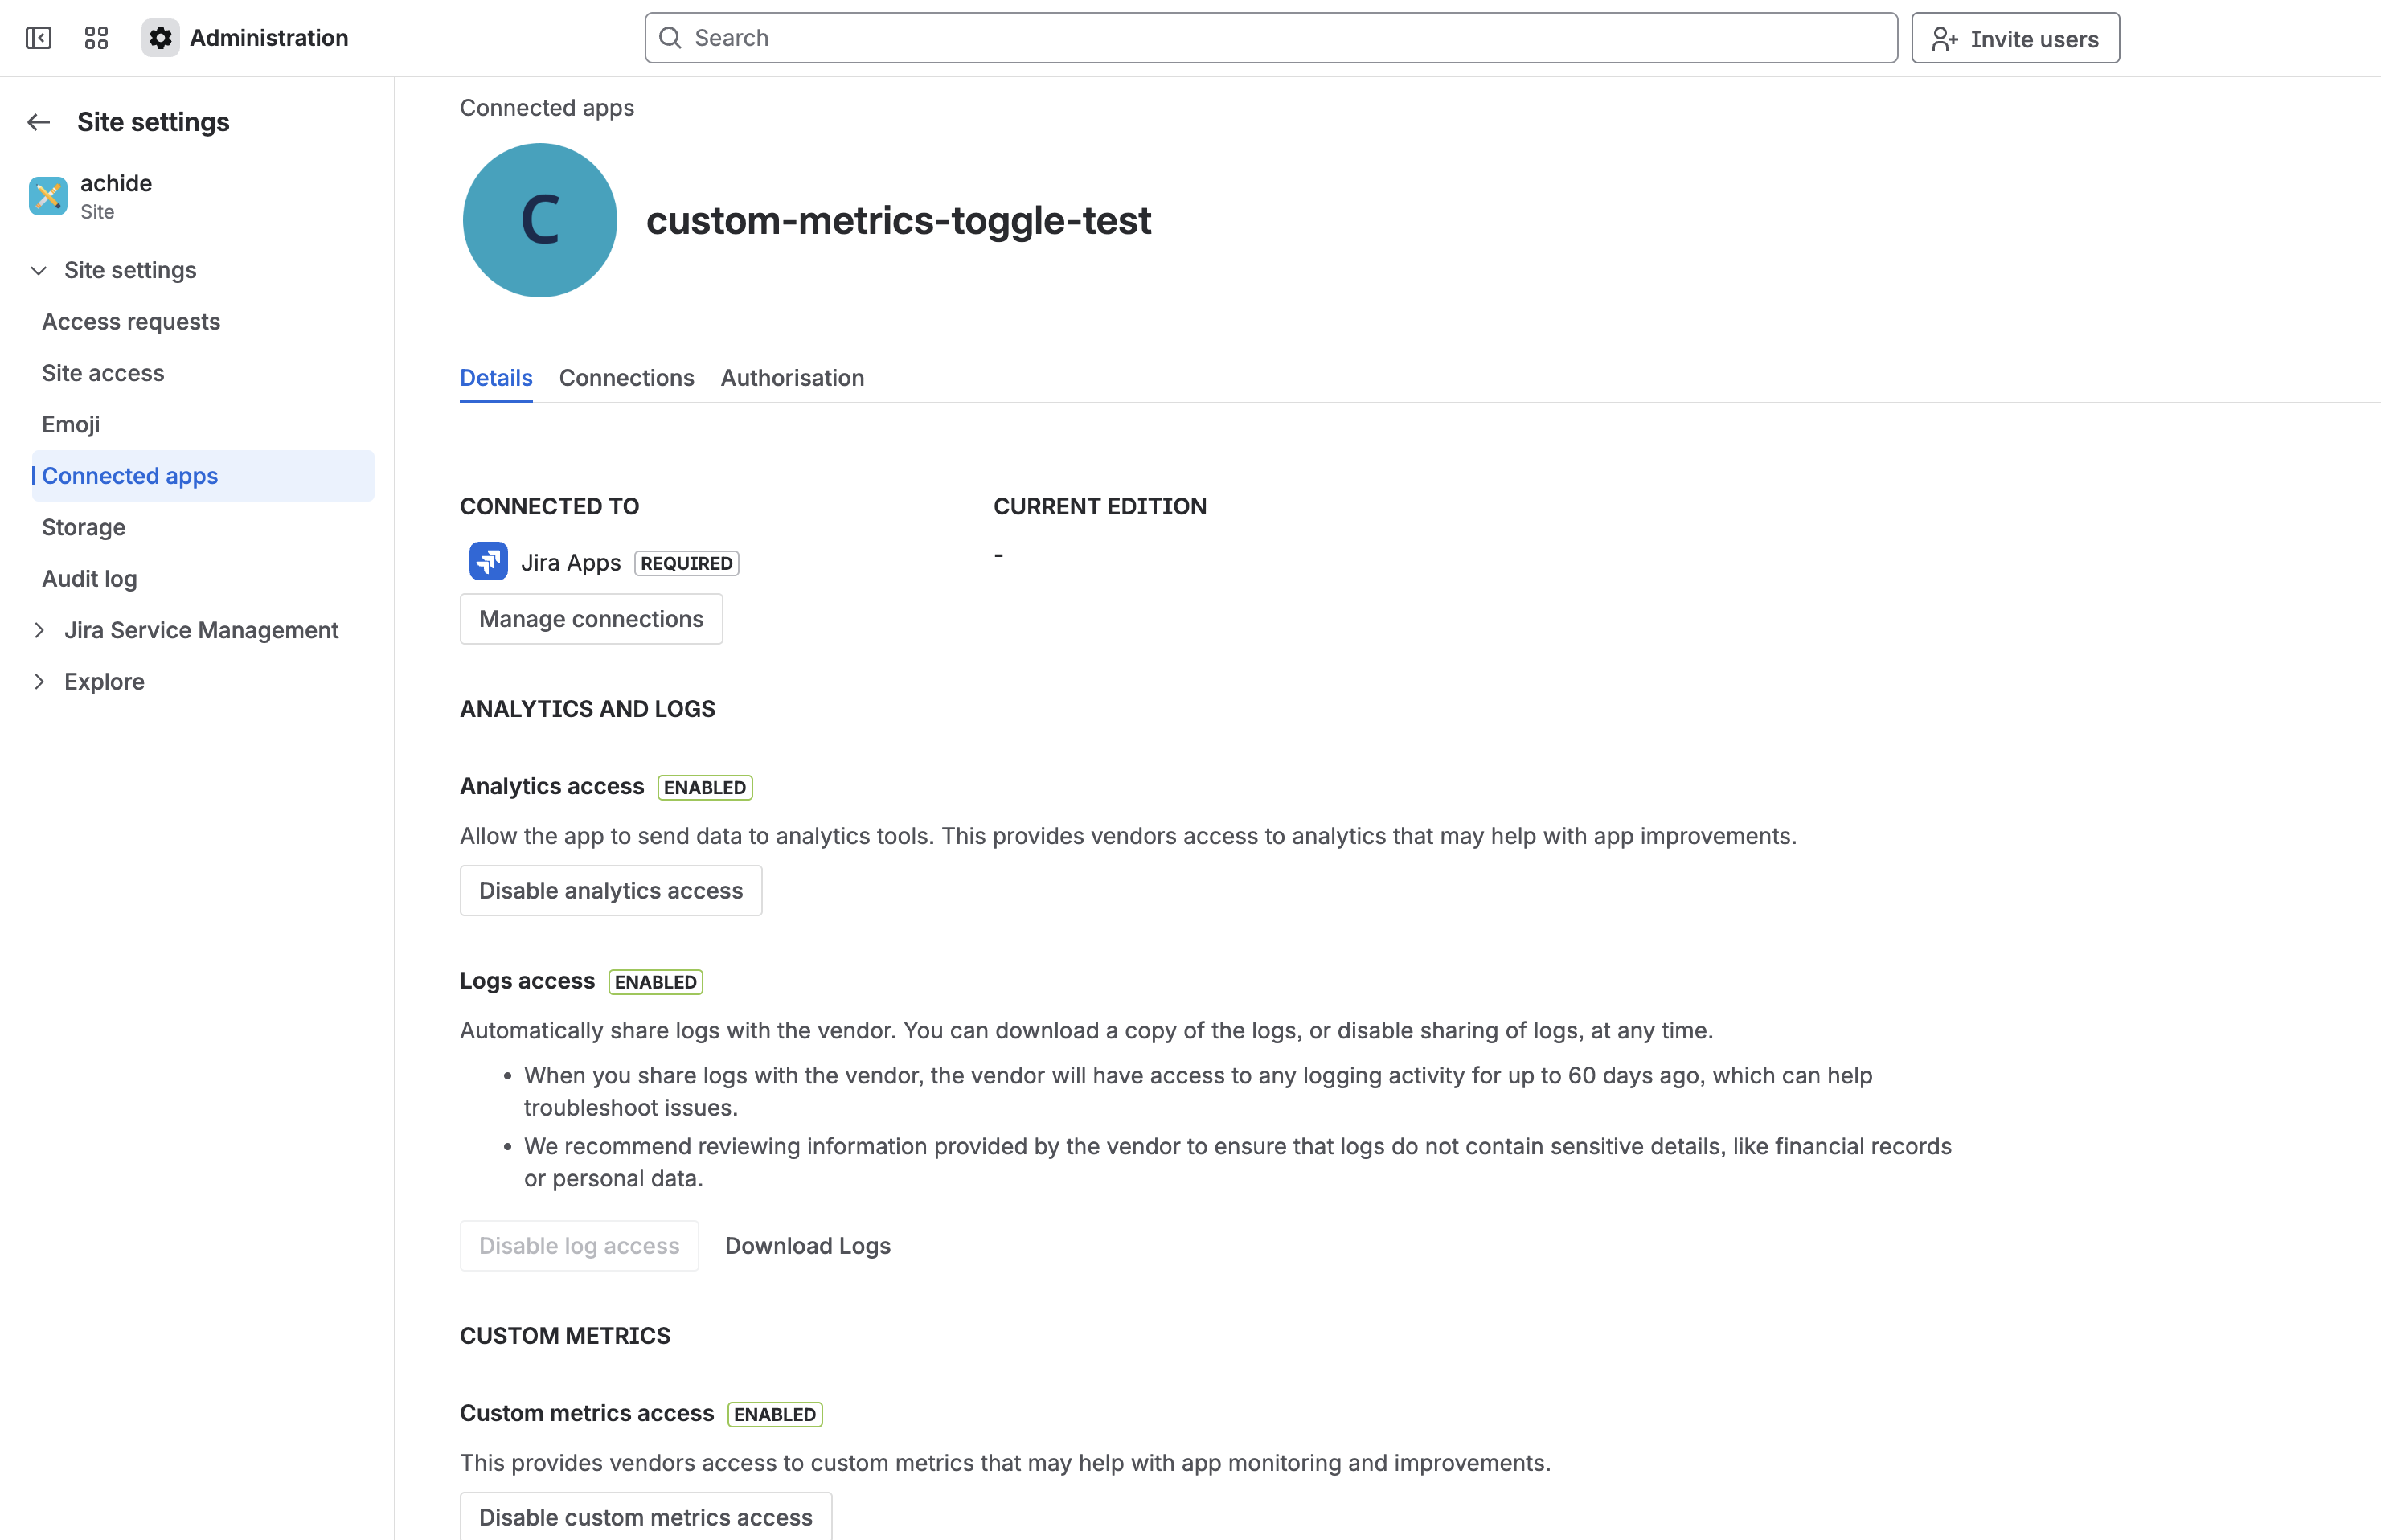
Re-enable custom metrics access
If your user is experiencing problems with your app, but has disabled custom metrics access for their site, you might need them to re-enable custom metrics access.
Give customer the following instructions:
-
Go to admin.atlassian.com.
-
Select the relevant site.
-
Select Apps in the global navigation.
-
In the Sites section of the lefthand navigation, select the site you're administering apps for.
-
In the lefthand navigation, select Connected apps.
-
Select the action button for the app you want to enable custom metrics for.
-
In the Details tab, under Custom metrics access, enable the setting.
Your user sees a screen like this, showing the details of your app and the controls for enabling or disabling access to their site's custom metrics.
Rate this page: