Monitor usage metrics and cost
Atlassian will continue to offer free use of the Forge platform through 2025. Starting 1 January 2026, Forge will transition to a consumption-based pricing model, featuring a generous free tier. Developers can monitor their app's resource consumption using Forge usage metric in preparation for the pricing changes in 2026.
Forge usage metrics help you understand and identify issues with resource consumption in a Forge app. They provide insights into services, such as compute, storage, and logs. When monitoring usage metrics, we recommend using filters to refine the results.
View app resource usage and costs
To view your app’s resource usage:
-
Access the developer console.
-
Select the Forge app that you want to view metrics for.
-
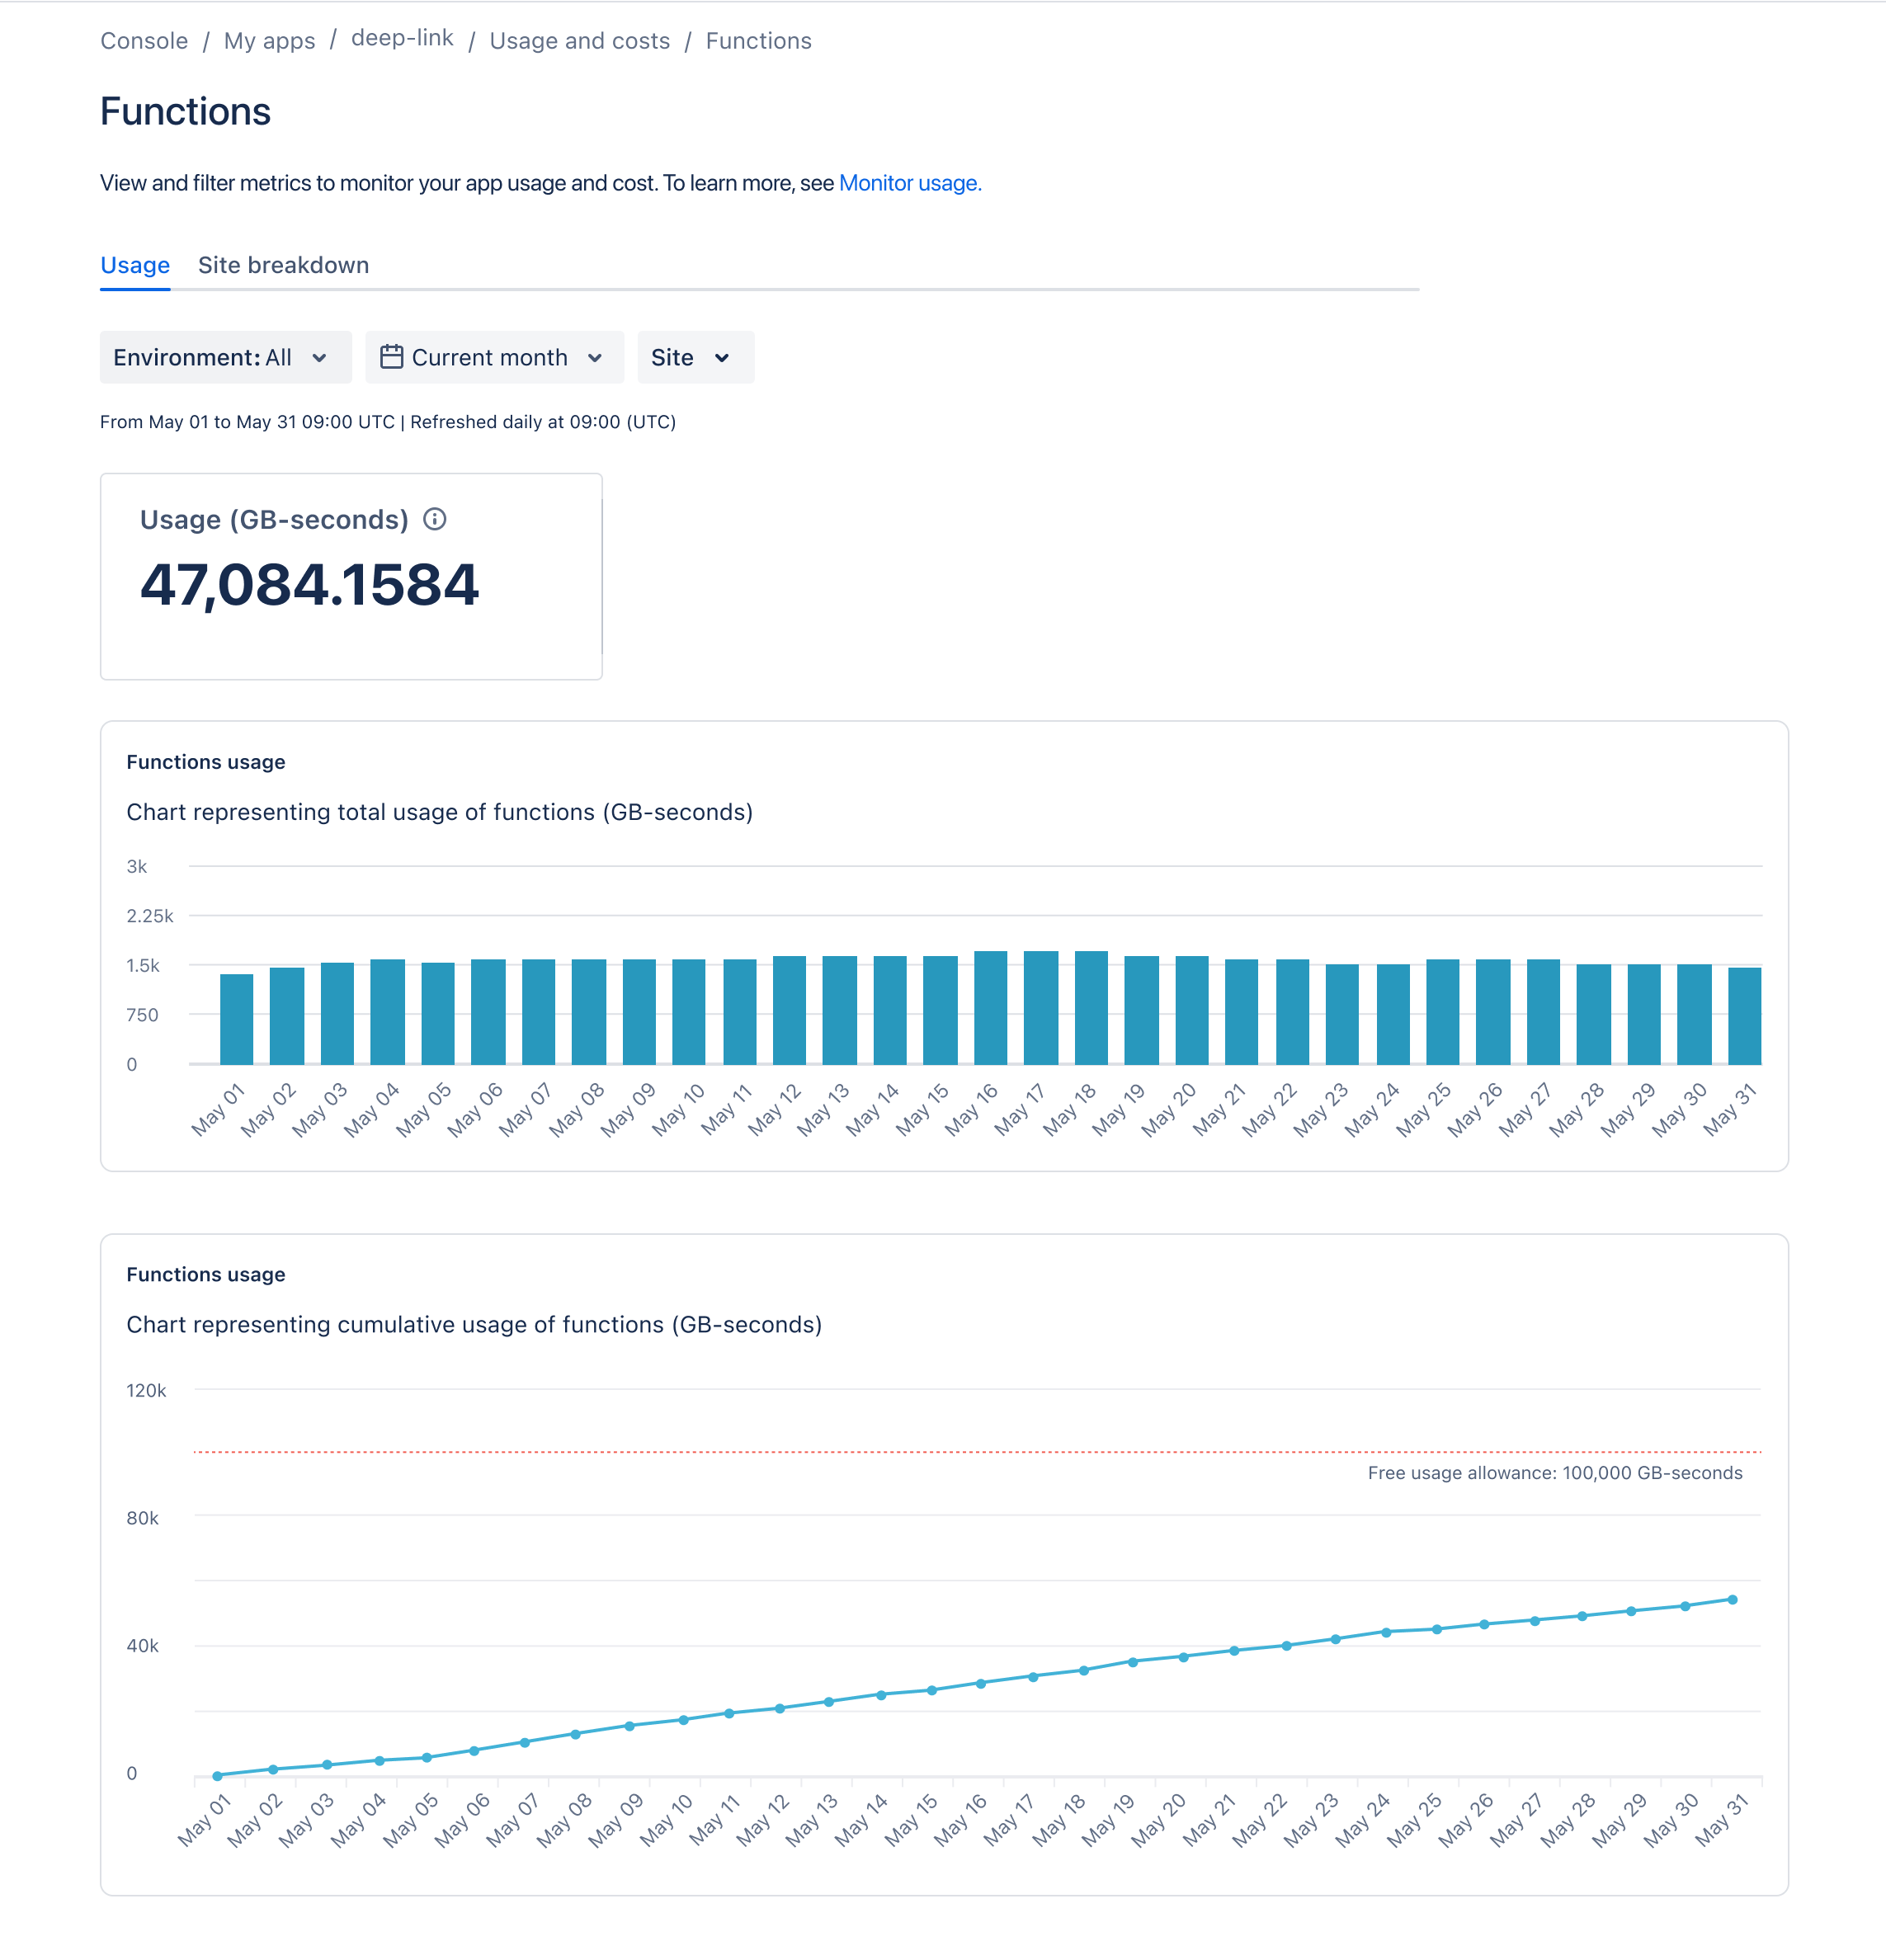
In the left menu, select Usage and costs, and then select the resource you want to view (for example, Functions - compute). Note that the daily data refresh occurs at
12:00 UTC.
Select your profile icon and toggle Display local timezone to convert the daily data refresh from 12:00 UTC to your timezone.
- To see a detailed breakdown of usage, select View Details for the specific resource you're interested in. You can use the date filter to customize the view, with the default setting showing data for the current calendar month.
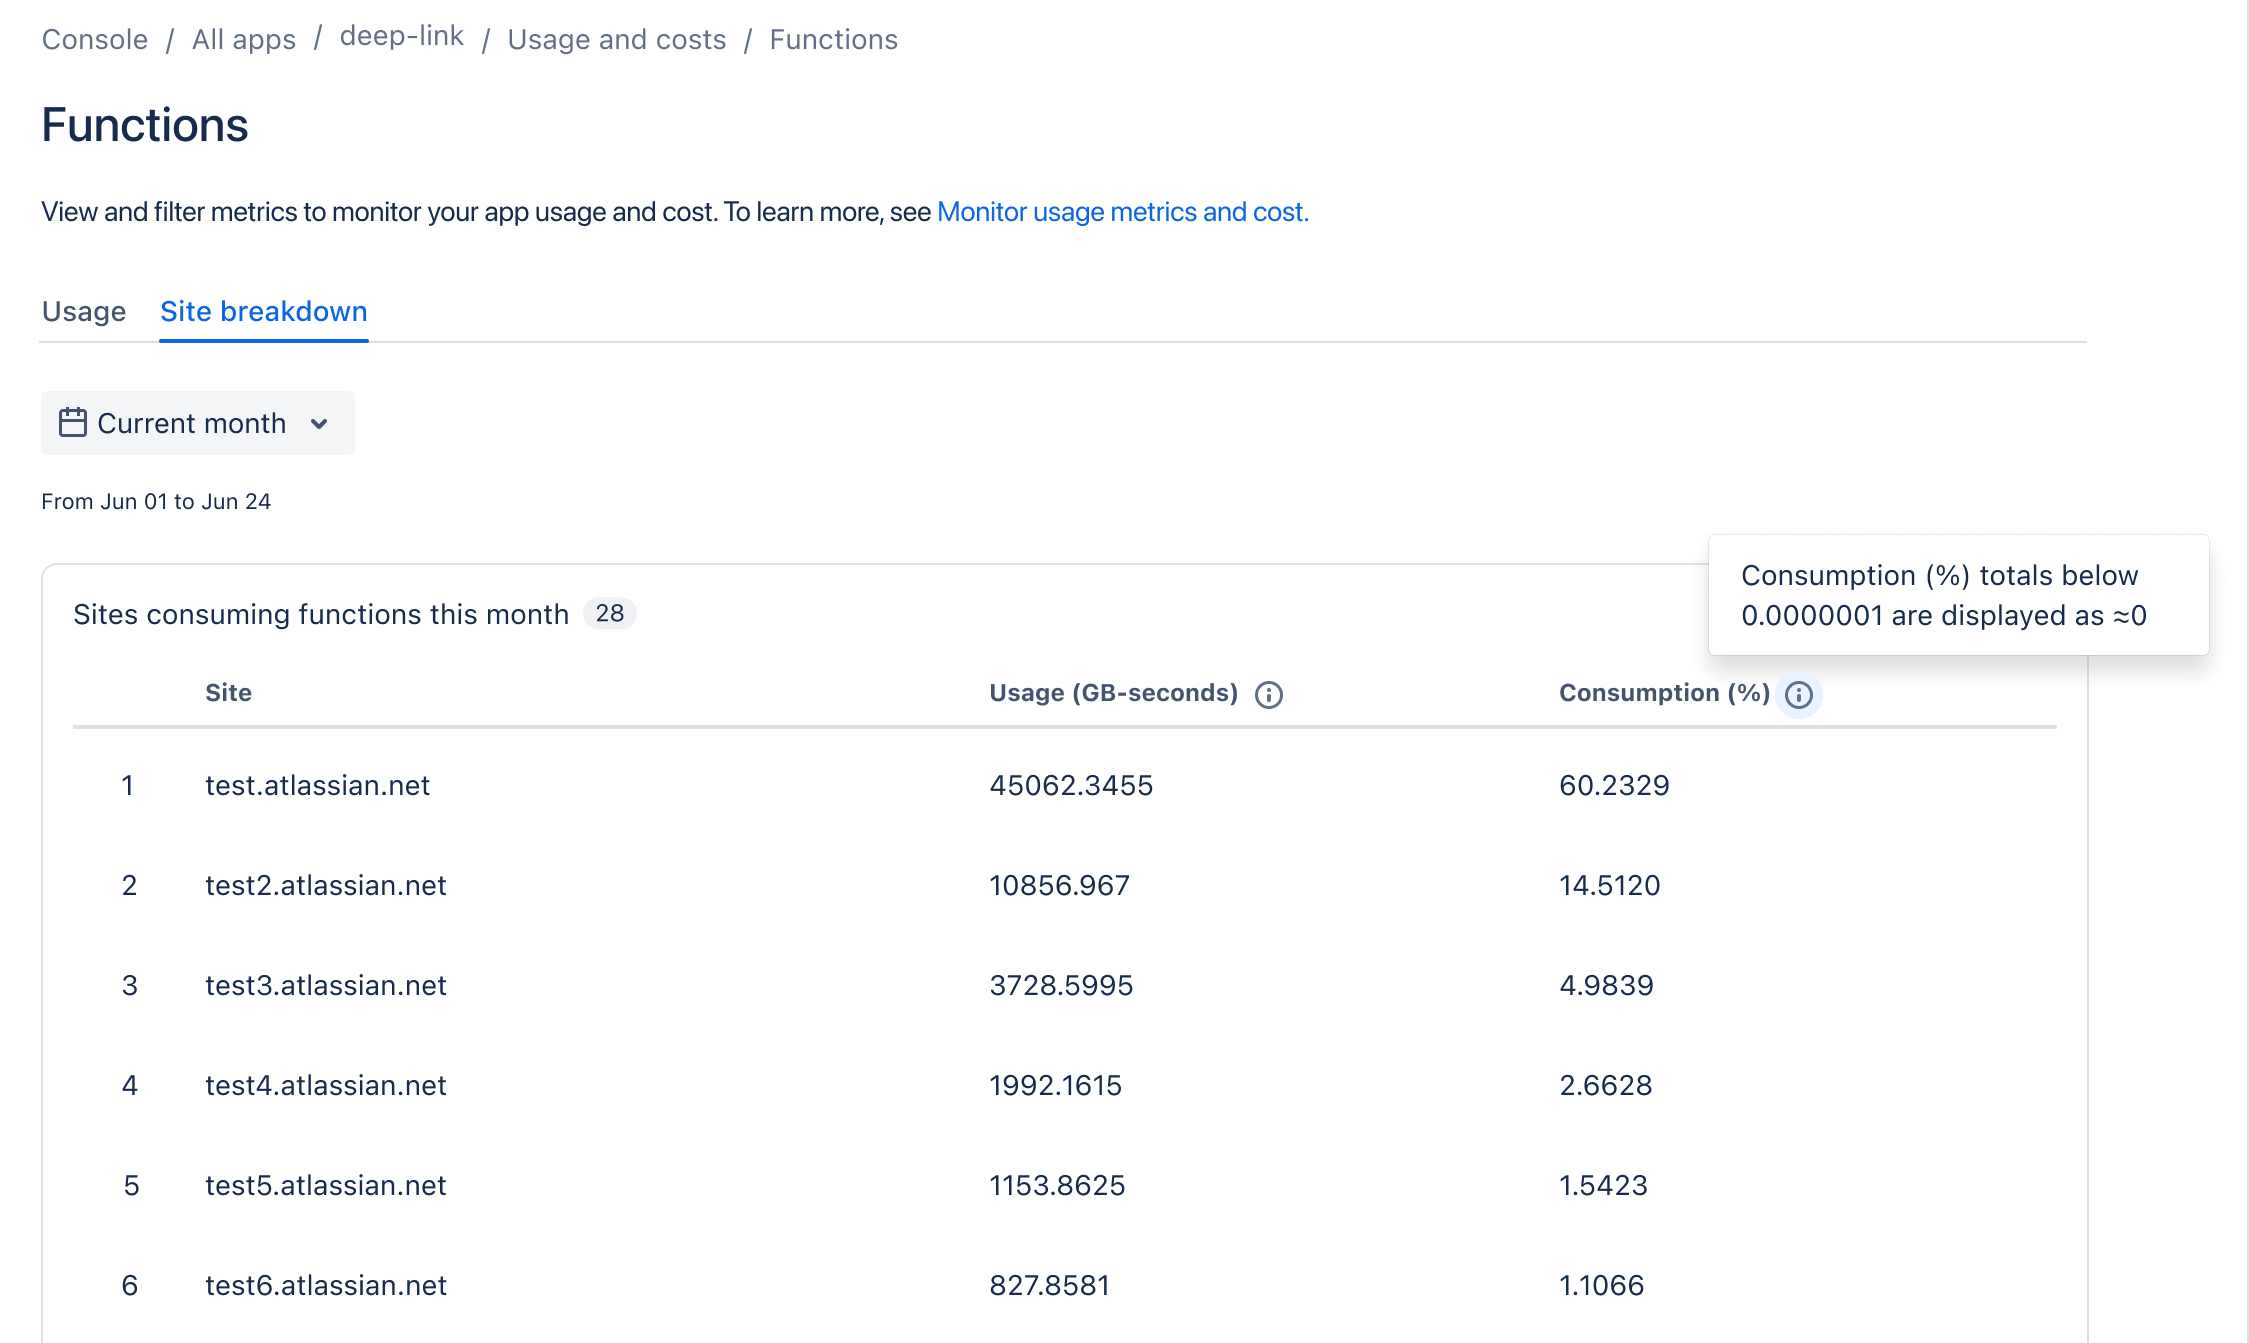
View site‑level resource usage for your app
To view a breakdown of all installation sites for your app with non-zero resource usage:
-
Access the developer console.
-
Select the Forge app that you want to view metrics for.
-
Select Usage and costs in the left menu, and then select the resource you want to view.
-
Select Site breakdown to view a list of sites with non-zero consumption of a particular resource.
Compute Usage
Compute, previously known as Function as a Service (FaaS), is measured in GB-seconds. This usage metric applies to compute functions used in any environment and represents the amount of computing resources your app consumes over time.
Compute functions in GB-seconds
Compute functions are measured by the duration your function runs and the amount of memory it consumes during that period. Currently, for all Lambda functions, the memory allocation by default is 0.5 GB.
1
2Compute in GB-sec = (Lambda Execution Time in seconds * 0.5) GB seconds
Storage usage
Storage metrics are measured in GB. These usage metrics apply to the use of Forge hosted storage in any environment.
Storage writes in GB
Storage writes are measured by the amount of data your app stores in key-value or entity storage. This metric tracks how much data your app writes to the Forge storage backend.
1
2Storage writes in GB = Total Data Written to Storage in GB
Storage reads in GB
Storage reads are measured by the amount of data your app retrieves from key-value or entity storage. This metric tracks how much data your app reads from the Forge storage backend.
1
2Storage reads in GB = Total Data Read from Storage in GB
Logs usage
Log metrics are measured in GB. This usage metric represents the amount of logging performed by your app over a period of time.
Log writes in GB
Log writes are measured by the amount of data generated from your app's log statements using console.log() or similar methods. The metric includes the size of the log messages and any metadata. Metadata may include timestamps, log levels, and additional contexts such as stack traces or request IDs.
1
2Log writes in GB = Total Data Written to Logs in GB
SQL usage
SQL usage metrics help you monitor and understand the resource consumption of your app's SQL operations. These metrics provide insights into the compute time, number of requests, and storage used by your app when interacting with Forge SQL storage.
SQL compute duration
SQL compute duration measures the total time your app spends executing SQL queries across all environments. This metric helps you understand the compute resources consumed by your SQL operations.
1
2SQL compute duration (in hours) = Total execution time of all SQL queries (in hours)
SQL compute requests
SQL compute requests count the total number of SQL queries executed by your app. This includes all types of SQL operations (for example, SELECT, INSERT, UPDATE, DELETE).
1
2SQL compute requests = Total number of SQL queries executed
SQL data stored
SQL data stored measures the total amount of data your app has stored in Forge SQL storage, expressed in gigabytes (GB). This metric helps you track your app's storage footprint over time.
1
2SQL data stored (in GB) = Total data stored in Forge SQL storage (in GB)
Filters
Use these filters to refine your metrics:
-
Environment: Narrows down the metrics for a specific app environment for your app.
-
Date: Narrows down the metrics based on your chosen time interval. Choose from a range of predefined values, such as the Last month, or choose a more specific time interval using the Custom option.
-
Sites: Narrows down the metrics based on the sites that your app is installed onto, for example,
<your-site>.atlassian.net. You can select multiple sites.
You can also bookmark the URL on your browser to access usage metrics based on specific filtering criteria for quick access. This is useful for repeated checks of the same metrics, saving time and effort in reapplying preferred filters.
You must use data in accordance with the privacy rights that you've obtained from your user. For more information, see the Atlassian Developer Terms and Forge Terms.
Limitations
-
Usage metrics are available for the last 60 days.
-
Site filters will display sites that have had at least one invocation within the past 31 days.
Rate this page: