Profile NodeJS app performance with the Forge tunnel debugger
Profiling app code is an essential method to analyze and optimize the code. This tutorial demonstrates how to perform CPU or memory profiling on NodeJS app code with VS Code via Forge tunnel.
To familiarise yourself with debugging and profiling, see:
For a step-by-step guide on completing this tutorial, check out this video:
Before you begin
This tutorial assumes you're already familiar with the basics of Forge development and have completed Debug Forge functions using VS Code. If this is your first time using Forge, see Getting started first. In addition, you’ll also need to install version 9.2.0 (or higher) of the Forge CLI.
Set up and trigger debugging
Let’s apply what we have learned from Debug Forge functions using VS Code to do performance profiling on a Forge app code.
-
Run tunnel with the debugger option. Replace the
index.runFirstMacrowith the function handler you want to debug.1 2
forge tunnel --debug --debugFunctionHandlers index.runFirstMacro -
Open VS Code and run debugging to attach the debugger. Put a breakpoint where you want to start profiling.
-
Trigger app code function by, for example, refreshing a Confluence page or accessing a Jira issue.
Configure profiling
-
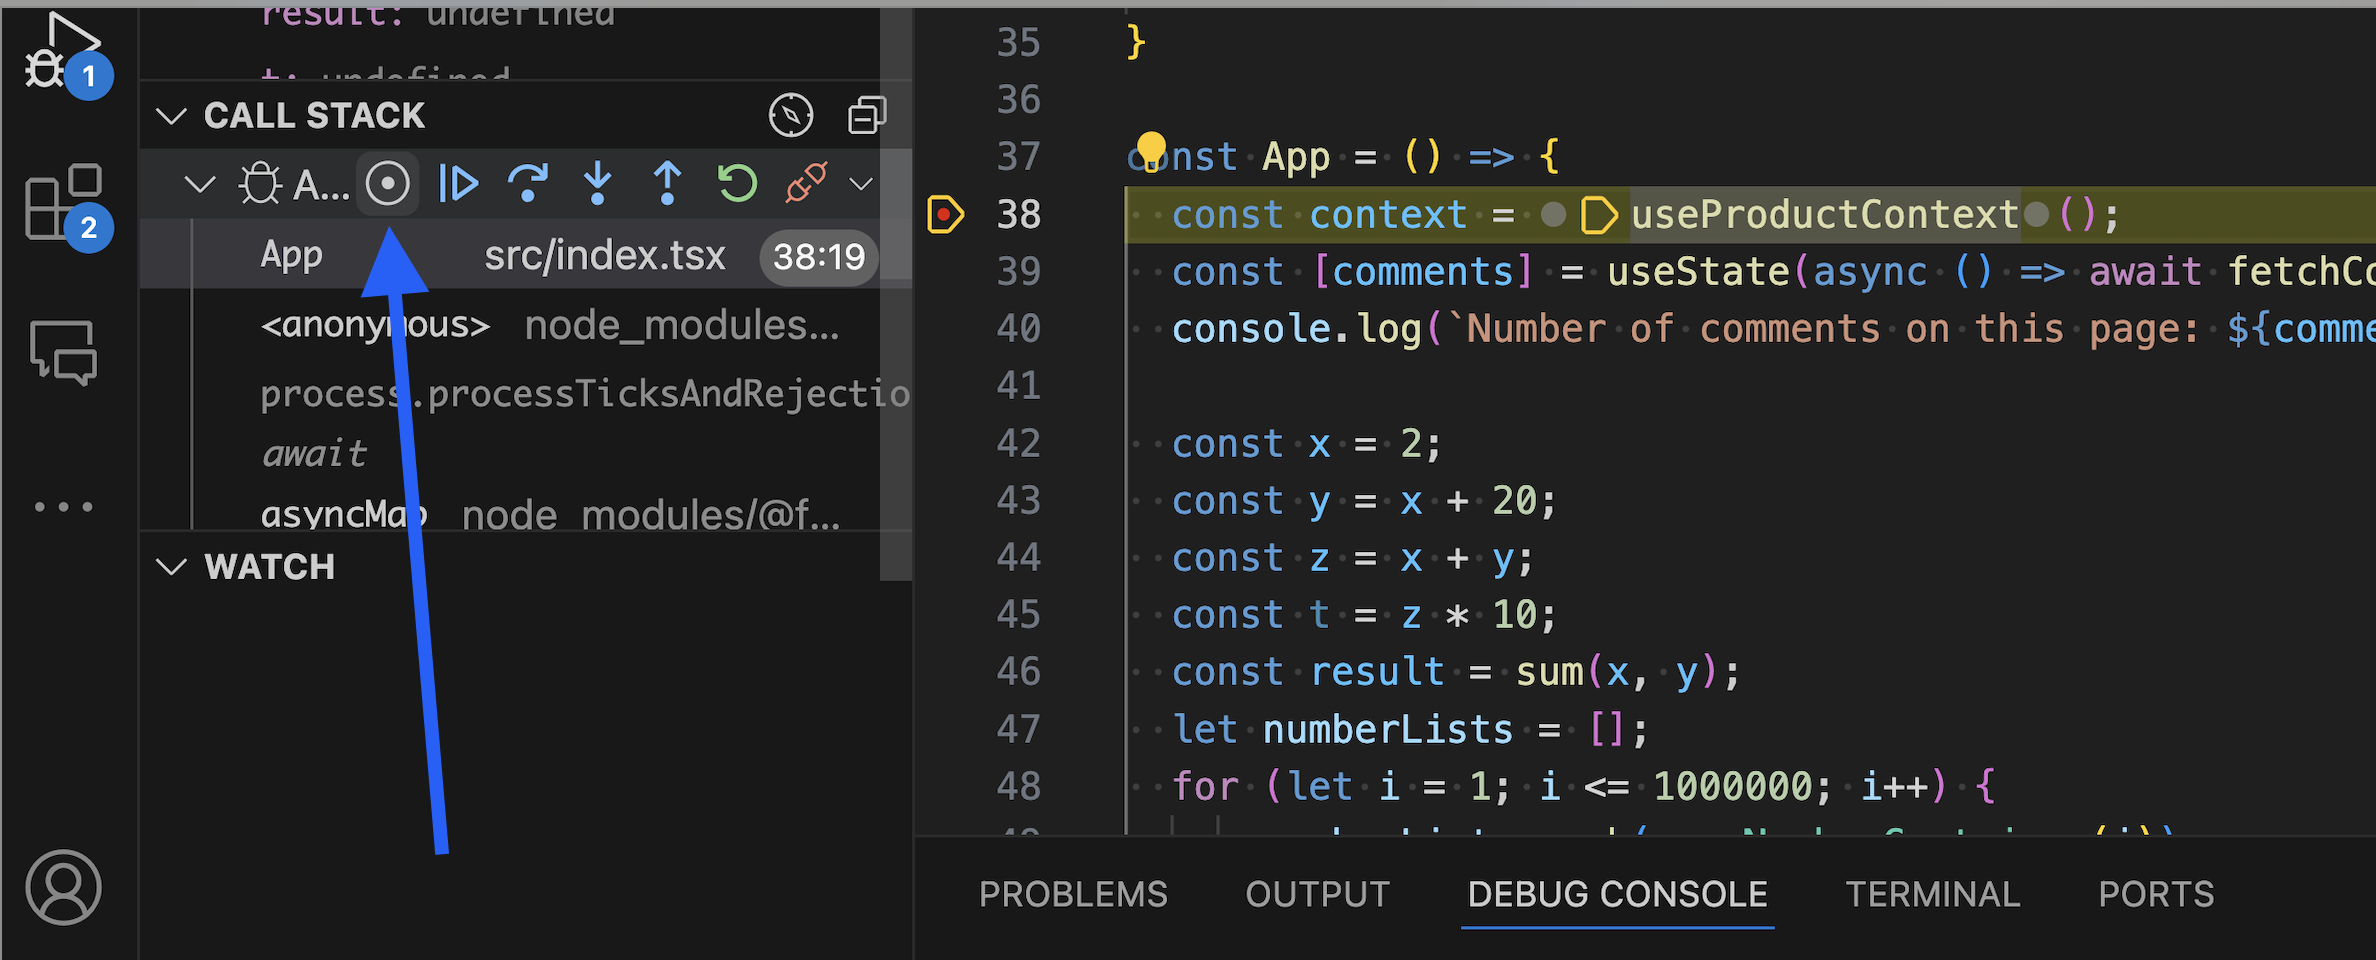
Start profiling by clicking on the Call Stack view. Hover over the session you want to debug, and select the Take Performance Profile icon (see screenshot for reference).
-
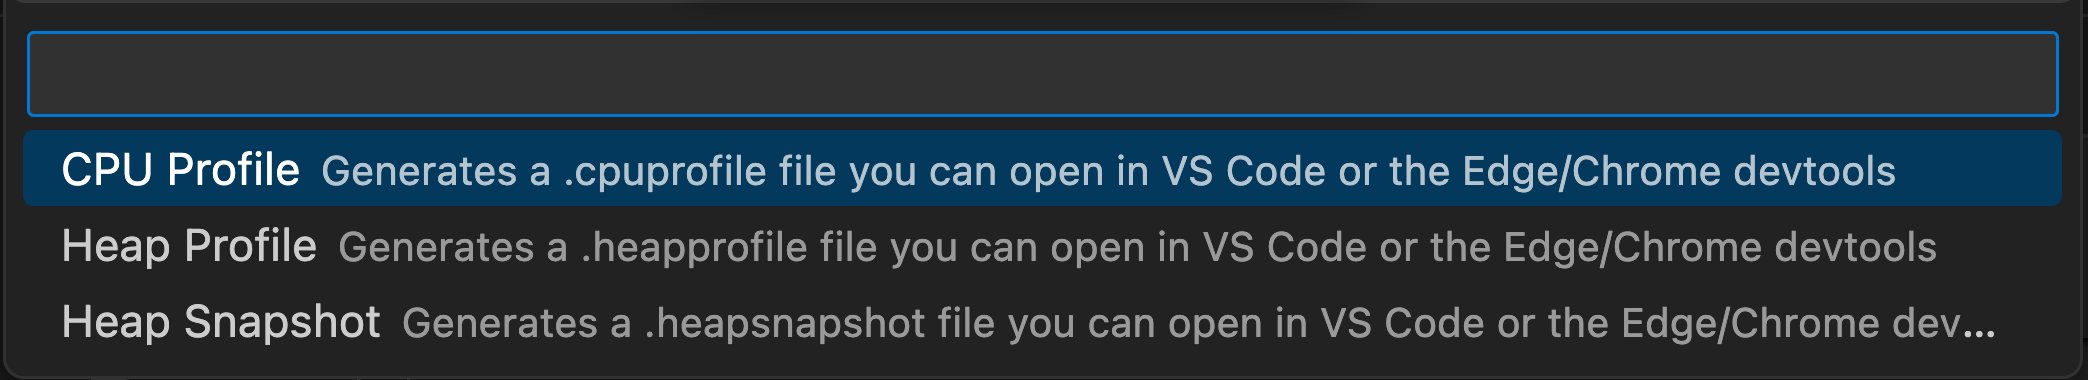
Select the profiling you want to conduct. It can be a CPU profile, heap profile, or heap snapshot. See Types of profiles for more details.
-
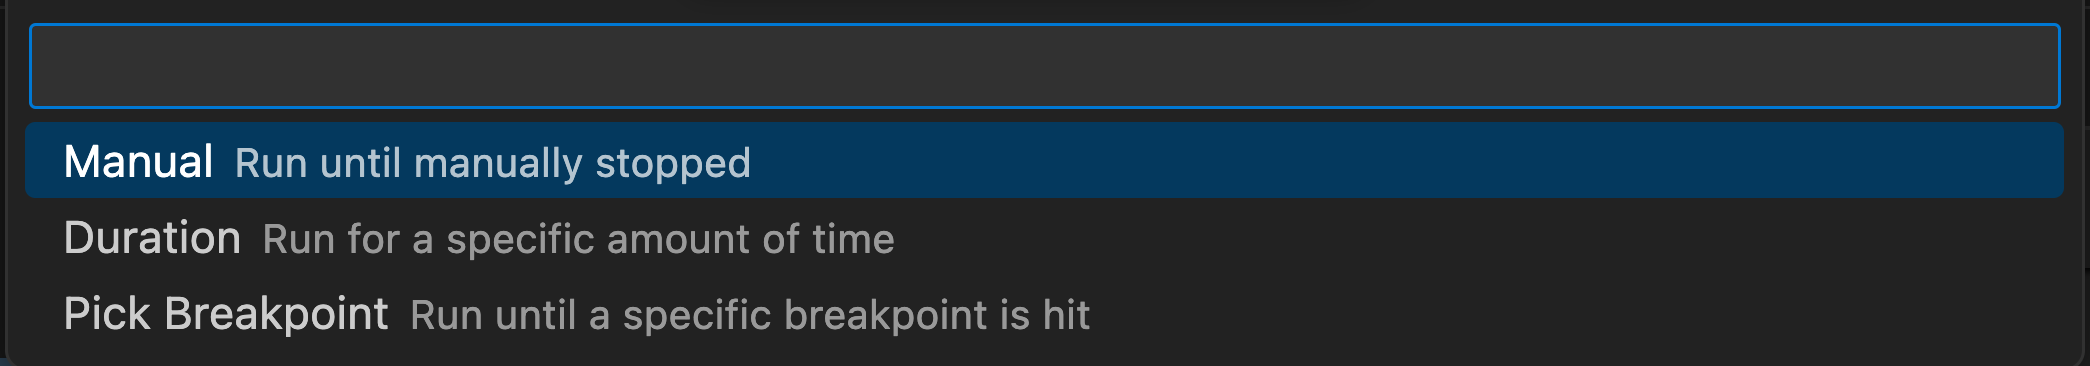
If you select CPU Profile or Heap Profile, you will need to select how long the profiling is:
View profiling results
-
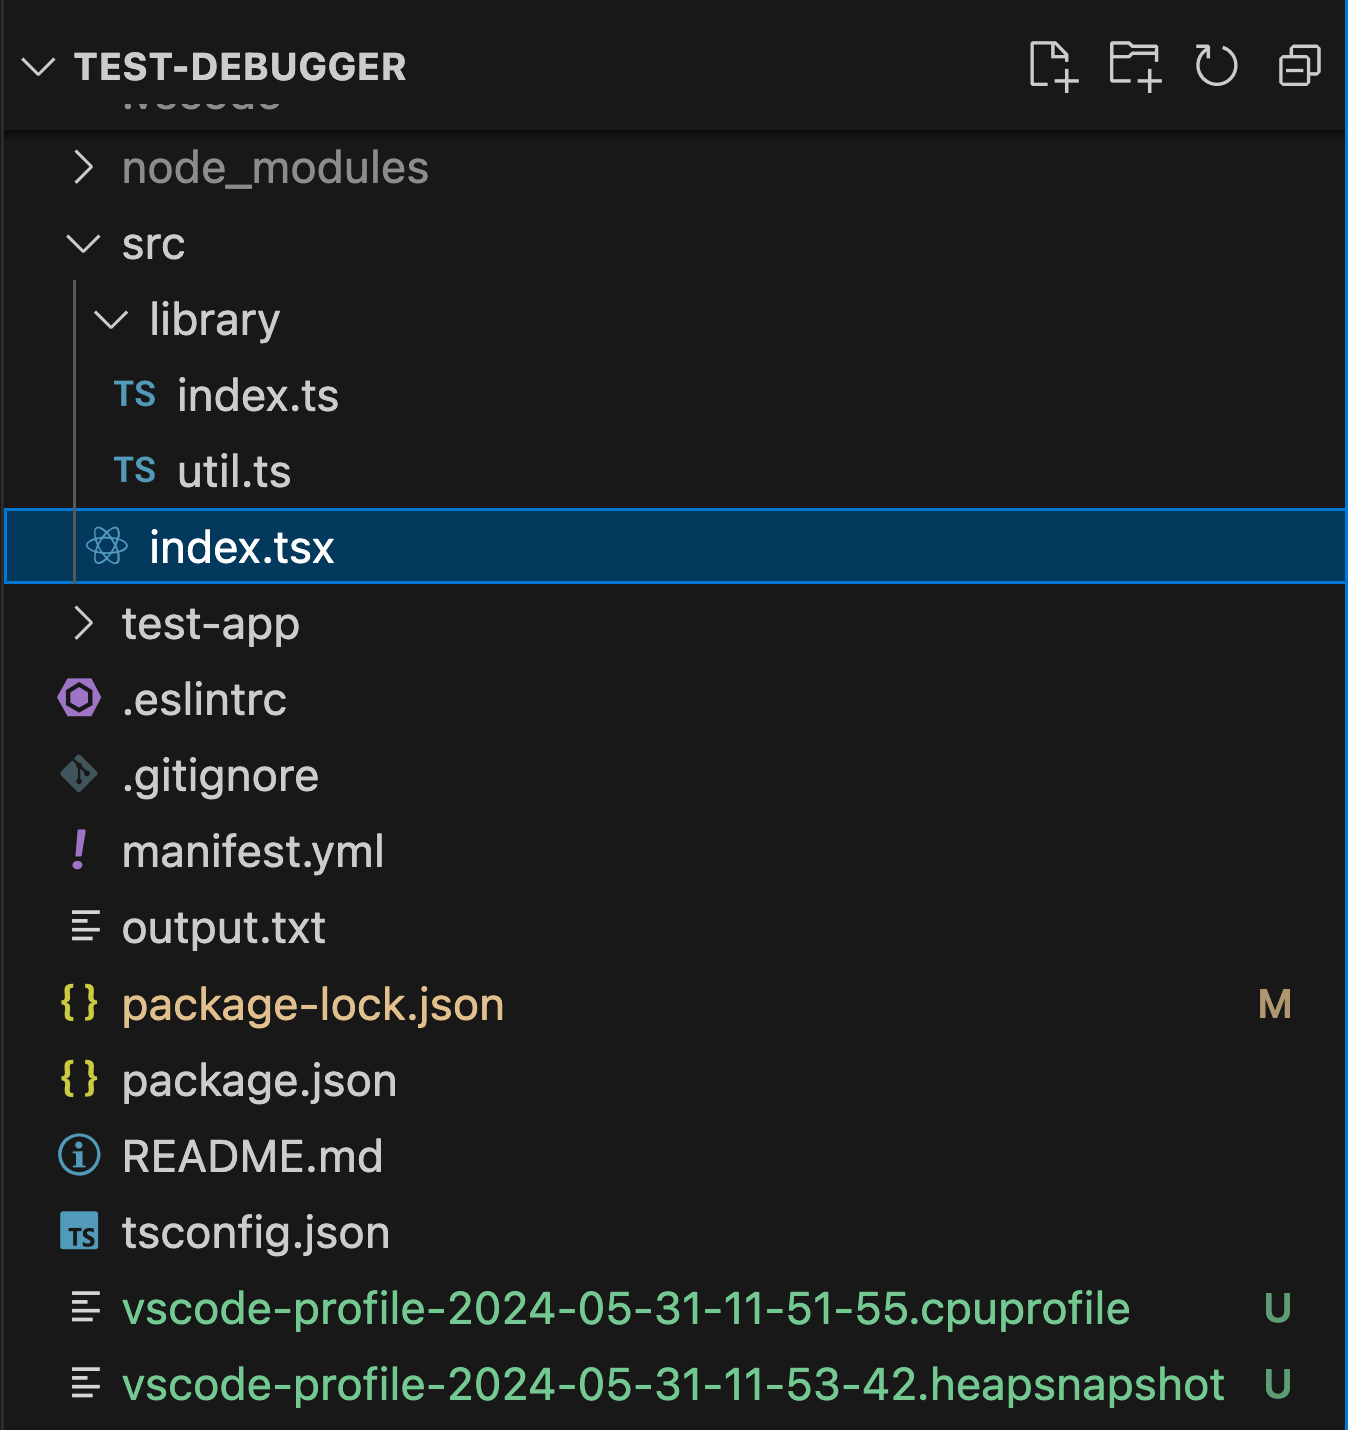
Examine the profiling result. Once the profiling is completed, it will be generated at the top-level of the app code directly as the last 2 files in the screenshot.
Developing for Atlassian Government Cloud
This content is written with standard cloud development in mind. To learn about developing for Atlassian Government Cloud, go to our Atlassian Government Cloud developer portal.
Rate this page: