Monitor SQL
Forge SQL provides reliability and latency metrics to help you understand your app's database interactions. It also provides some observability into the health of each provisioned database, as well as their respective schemas.
- Access the developer console.
- Select SQL in the left menu (under STORAGE).
From there, you can choose between the following observability options:
-
Monitor: tracks your app's reliability and performance. You can do this across all installations, or filter information by any combination of site, environment, or time frame. See Performance and health for more information.
-
Manage: provides insights on database schemas for individual installations. See Schema details for more information.
To use SQL observability features on the developer console, make sure to redeploy your app with the latest version of the Forge CLI.
Performance and health
The Monitor page lets you view the health of SQL databases provisioned across different installations. This page provides information about the performance and reliability of your app's SQL queries across different environments, sites, and time frames. You can find this page through the left menu (under STORAGE > SQL).
HTTP response status codes
HTTP response status codes are indicators of whether or not a specific HTTP request has been successfully completed. When monitoring SQL performance, you can scan the volume of the most frequent responses for each status code. The data resolution of each chart depends on the time interval you've selected.
You can see a summary of the following status codes in the developer console:
| Status code | Description |
|---|---|
| 2xx - Success |
|
| 4xx - Client errors |
|
| 5xx - Server errors |
|
Query execution time
Query execution time is the total amount of time that it takes for an SQL operation to receive a request, process the request, and send a response back to the client. Execution time starts as soon as the client initiates the request and ends as soon as the client receives a response from the server.
Percentiles are often used when measuring response times. Percentiles provide a different view of your performance data.
When monitoring response time, you can see a summary of the following percentiles involving the response times of all operations being performed by your Forge app:
| Percentile | Description |
|---|---|
| P50 - Median |
|
| P95 - 95th percentile |
|
| P99 - 99th percentile |
|
You can also scan the latency of the 50th percentile, 95th percentile, and 99th percentile response times of SQL operations in the response time chart. The data resolution of the chart depends on the time interval you've selected.
Slow queries
On the Query execution time page's Site breakdown section, each listed site includes a link to its Slow queries page. Forge SQL tracks queries that take longer than 500ms to resolve (on average), and this page displays the 10 slowest ones.
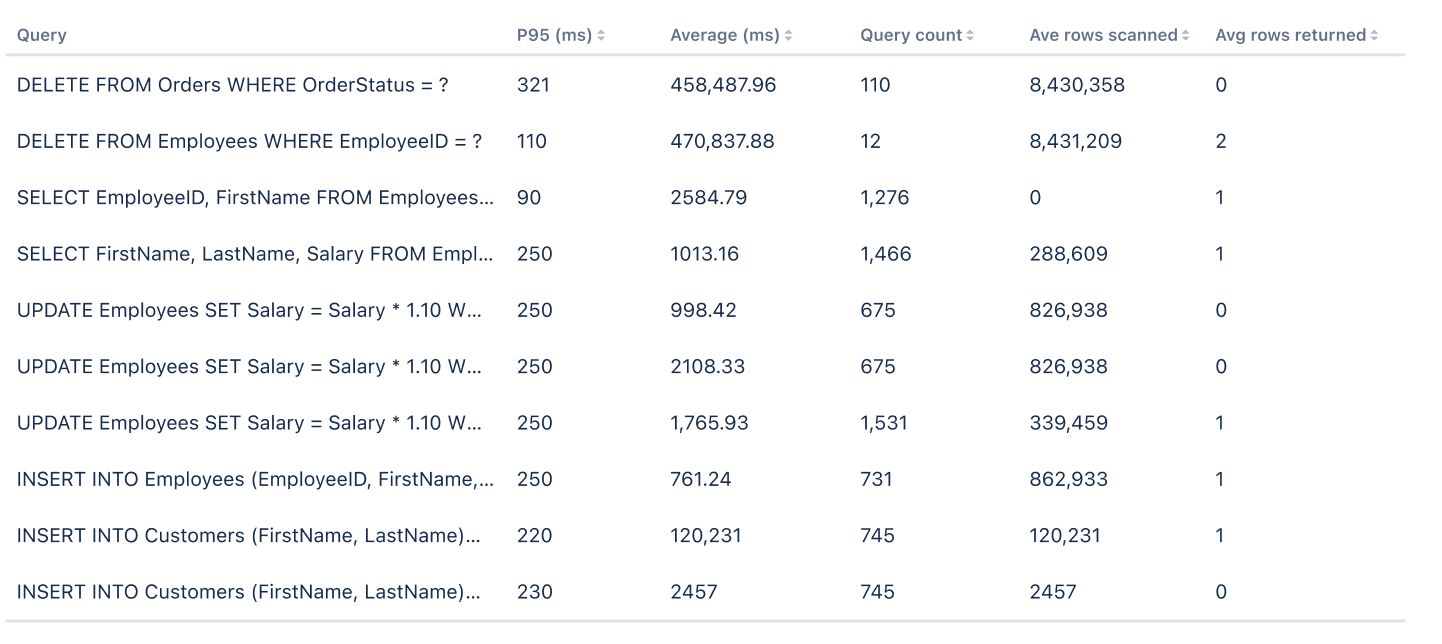
For a CSV export of all queries' average time to resolve, click the Download button.
Filters
Use these filters to refine the data you're inspecting.
-
Environment: Narrows down the metrics for a specific app environment for your app.
-
Date: Narrows down the metrics based on your chosen time interval. Choose from a range of predefined values, such as the Last 24 hours, or choose a more specific time interval using the Custom option.
-
Sites: Narrows down the metrics based on the sites that your app is installed onto, for example,
<your-site>.atlassian.net. You can select multiple sites. -
Atlassian app: Narrows down the metrics to show data from a specific Atlassian app if your Forge app supports multiple Atlassian apps.
Your filter selections persist across different metrics. If you switch from one metric page to another, your chosen filters will remain active.
- Metrics are only shown for sites with at least one invocation in the past 14 days.
- All dates are in Coordinated Universal Time (UTC).
- Each chart's data resolution depends on the time interval you've selected. For example 'Last 24 hours' shows data at a 30-minute resolution, and 'Last hour' shows data at a 1-minute resolution.
- Metrics may not always be accurate because undelivered metrics data isn't back-filled and data sampling might be used for some metrics.
You can also bookmark the URL on your browser to access metrics based on specific filtering criteria for quick access. This is useful for repeated checks of the same metrics, saving time and effort in reapplying preferred filters.
You must use data in accordance with the privacy rights that you've obtained from your user. For more information, see the Atlassian Developer Terms and Forge Terms.
Schema details
The developer console also provides information each site's SQL database (including its size and schema details). You can also view which database schema updates have already been successfully completed on each installation.
To view this data on the developer console:
- Select Manage under SQL in the left menu.
- Search for the site whose schema you want to inspect. You can filter the list of sites by Environment, App Version, or Site name.
Once you find the target site, click its Schema details link. This will open the site's Schema details page.
The Schema details page can only provide information on database schema updates executed through the migrationRunner SDK. See
Manage your database schema for more information.
The Schema details page contains three sections: Database size, Successful migration events and Schema viewer.
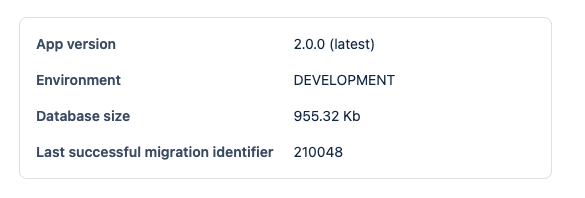
Database size
This section contains database size and metadata for the selected installation.
Successful migration events
This section lists all the DDL operations that Forge SQL was able to successfully execute on the site's database. The Migration event column shows a timestamp of each execution.
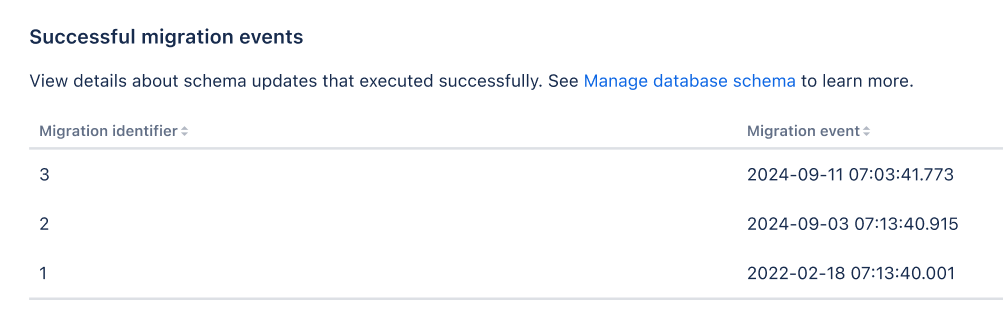
The Migration identifier column displays the ID that Forge SQL automatically assigns to each Data Definition Language (DDL) operation in your migrationRunner.enqueue invocation. This ID is simply the number matching their place in your invocation. For example, consider the following migrationRunner.enqueue invocation:
1
2const createDBobjects = migrationRunner
  .enqueue('v001_create_users_table', CREATE_USERS_TABLE)
  .enqueue('v002_create_books_table', CREATE_BOOKS_TABLE)
  .enqueue('v003_create_authors_table', CREATE_AUTH_TABLE)
Based on this, Forge SQL will assign the following Migration identifier to each DDL operation:
| DDL Operation | Migration identifier |
|---|---|
v001_create_users_table | 1 |
v002_create_books_table | 2 |
v003_create_authors_table | 3 |
Schema viewer
This section lets you view each table in the current database schema (including details about each table's respective fields).
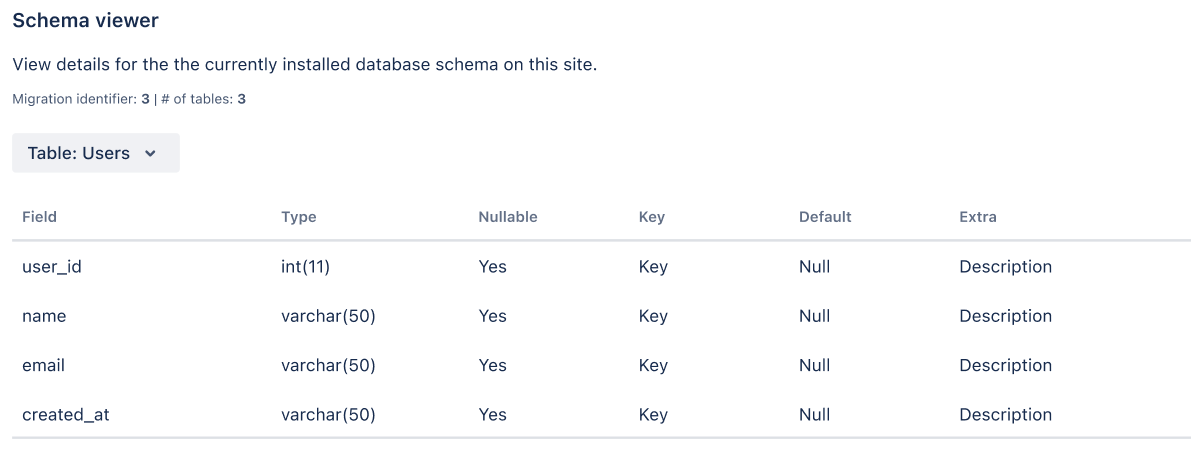
Table data tab
The Table data tab within the Schema viewer section can also let you inspect data stored inside a selected table. This tab is only visible when accessing the development, custom, or staging environment of your cloud developer site.

Hidden fields
The Table data tab within the Schema viewer won't display fields with the following database data types:
BLOBMEDIUMBLOBLONGBLOBBINARYVARBINARYCLOBTEXTIMAGEXMLJSON
These field are hidden to prevent the display of possibly large data payloads. These fields won't be included in the records provided through the Download button either.
Rate this page: