Developer Space insights dashboard
The insights dashboard gives you aggregated visibility across all Forge apps in your Developer Space. Instead of checking each app individually, you get a single view of log volume, errors, alerts, performance, and cost data. This helps you spot issues and act faster.
Not sure what a Developer Space is? See Overview of Developer Spaces
Developer Spaces and Forge platform pricing are not currently supported for Atlassian Government Cloud or Isolated Cloud environments.
Accessing the insights dashboard
- In the Developer Console, select your Developer Space.
- From the navigation menu, select Insights.
Permissions:
- Admins, Developers, and Viewers can all view the insights dashboard.
- No write actions are available from this page.
Dashboard charts
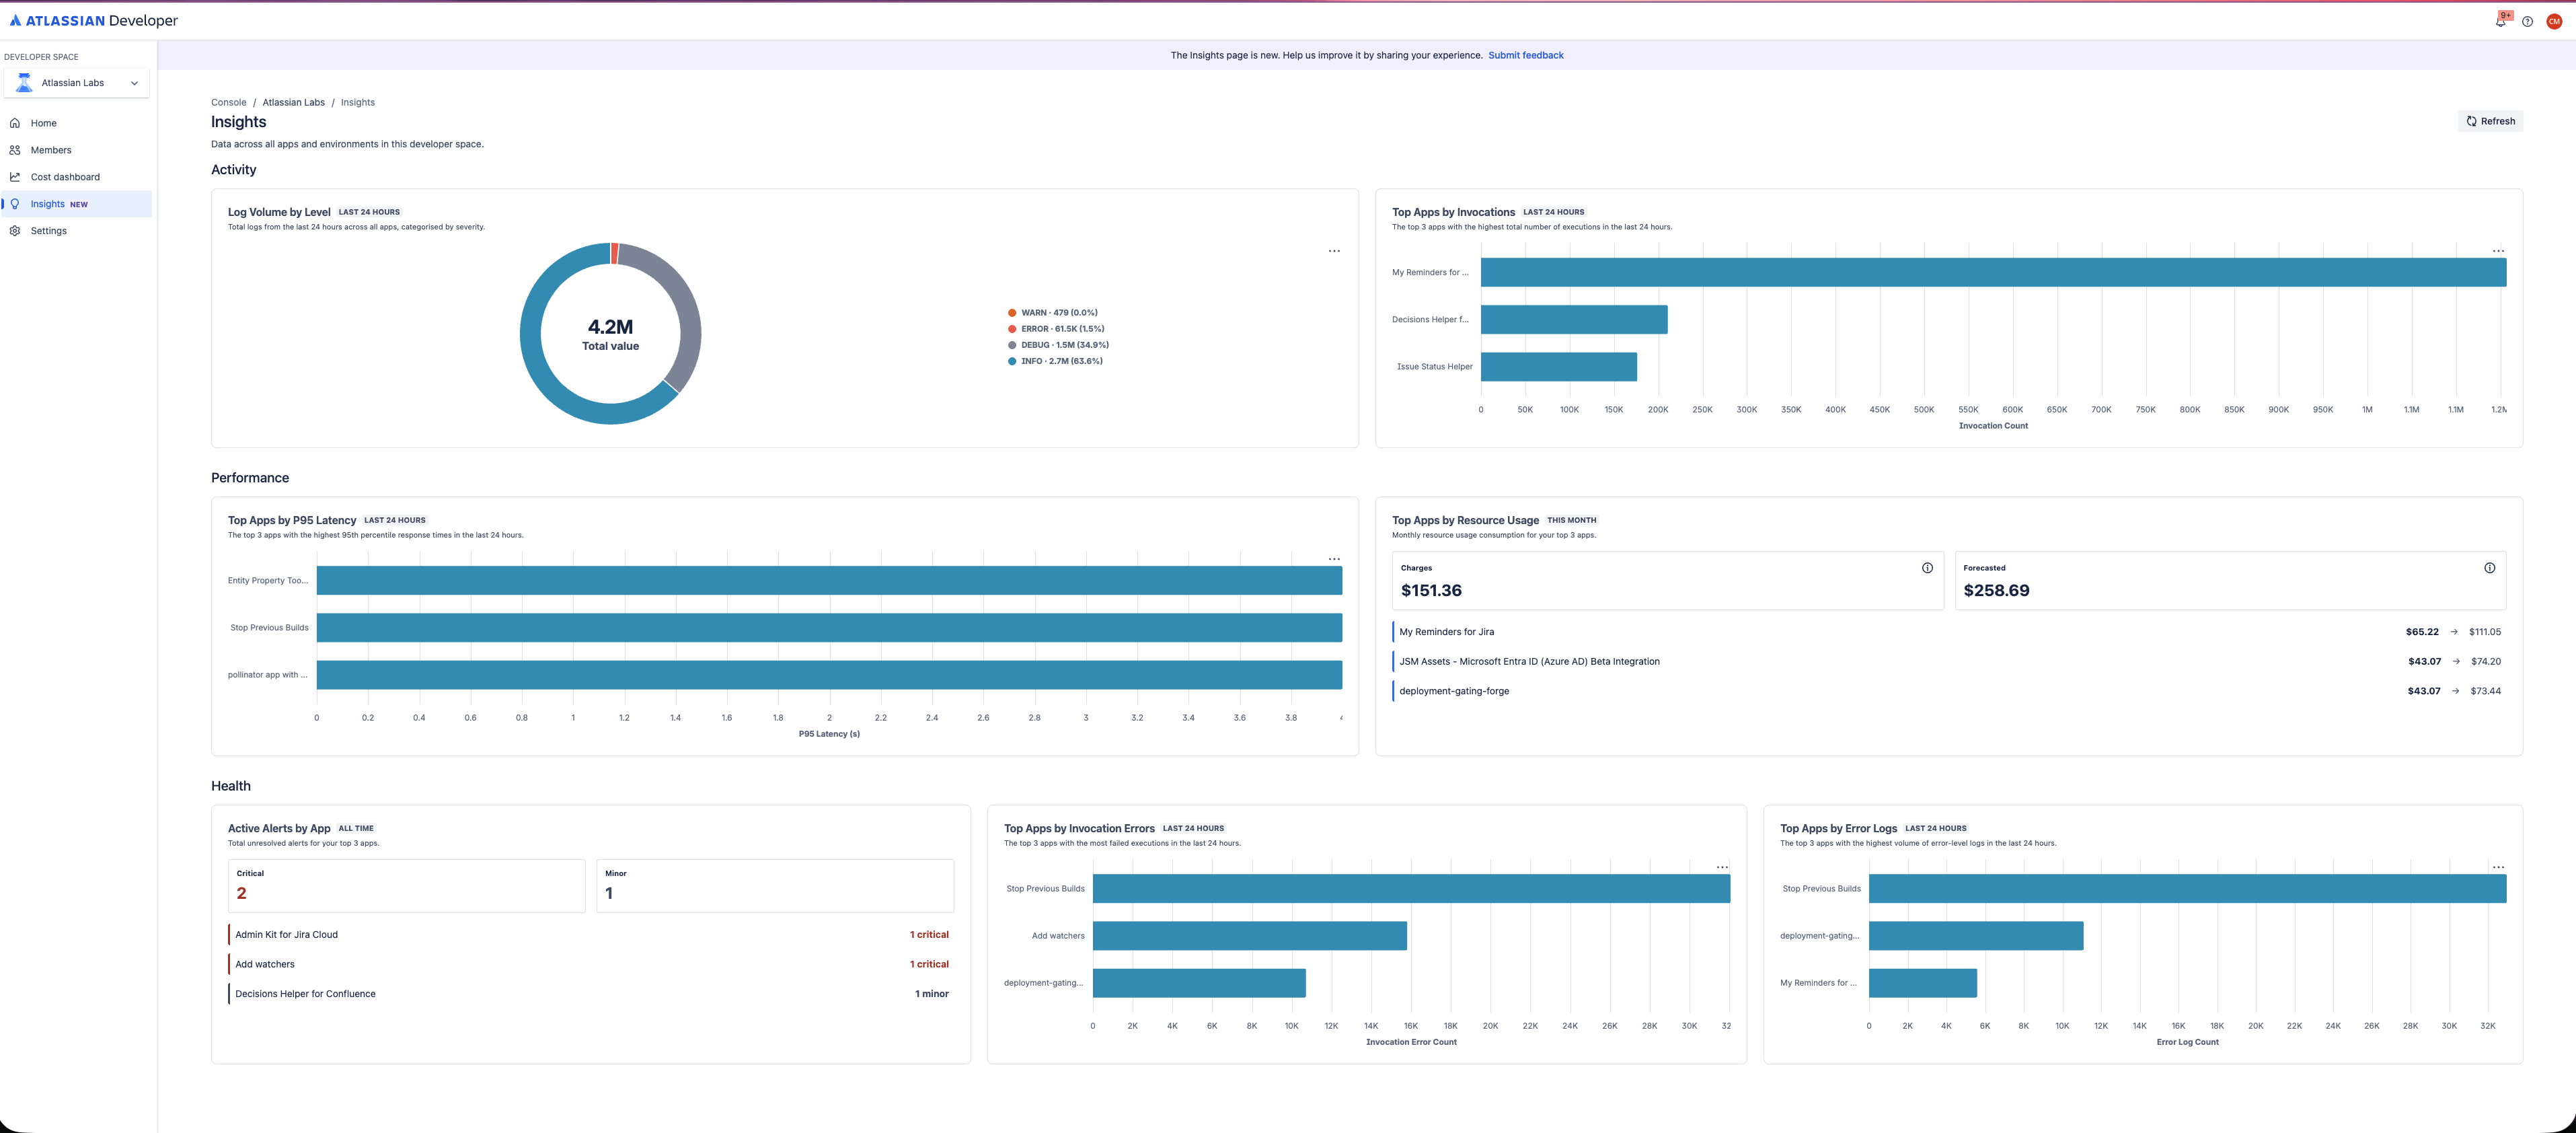
Log volume by level
This chart shows the total number of log lines generated across all Forge apps in the Developer Space, broken down by log level (such as INFO, WARN, ERROR, DEBUG).
Use this chart to:
- Understand your overall logging volume at a glance.
- Identify if a particular log level (for example, INFO) is dominating volume unexpectedly.
Apps by error log volume
This chart ranks your Forge apps by the number of error-level log lines they have generated. Up to three apps are shown for readability.
Use this chart to:
- Quickly identify which apps are generating the most errors.
- Click an app in the chart to navigate directly to its Logs view and investigate.
Open alerts by app
This chart lists apps that currently have open alerts. Up to three apps are shown.
Unlike other charts, open alerts are not filtered to the last 24 hours — they reflect all currently open alerts regardless of when they were triggered.
Use this chart to:
- See which apps need immediate attention.
- Click an app to navigate directly to its alerts view.
Apps by invocation errors
This chart shows the top three apps ranked by the number of invocation errors in the last 24 hours.
Use this chart to:
- Detect runtime failures across your app portfolio.
- Click an app to navigate directly to its Metrics view.
Apps by latency
This chart shows the top three apps ranked by response latency in the last 24 hours.
Use this chart to:
- Identify performance bottlenecks across your apps.
- Click an app to navigate directly to its Performance view.
Apps by invocation count
This chart shows the top three apps ranked by the total number of invocations in the last 24 hours.
Use this chart to:
- Understand which apps are most actively used.
- Click an app to navigate directly to its Metrics view.
Top apps by resource usage
This chart shows the top three apps by resource usage, drawn from the cost and usage dashboard.
Unlike other charts, this chart uses the last 30 days of data rather than the last 24 hours.
Use this chart to:
- Track which apps are contributing most to your Forge compute costs.
- Click an app to navigate directly to its Cost & Usage view.
Drilling down into an app
Most charts in the insights dashboard support drill-down navigation. Clicking an app name or data point takes you directly to the relevant section of that app's monitoring experience:
| Chart | Destination |
|---|---|
| Apps by error log volume | App Logs view |
| Open alerts by app | App Alerts view |
| Apps by invocation errors | App Metrics view |
| Apps by latency | App Performance view |
| Apps by invocation count | App Metrics view |
| Top apps by resource usage | App Cost & Usage view |
Data scope and limitations
| Attribute | Detail |
|---|---|
| Default time range | Last 24 hours |
| Exceptions | Open alerts (all time); Top apps by resource usage (last 30 days) |
| Environments included | Production, development, and staging |
| Apps shown per chart | Top 3 apps (for readability) |
Next steps
Rate this page: