Cloud churn
This Cloud churn report shows you the data for all the licenses for your cloud apps for which the licenses were either cancelled or expired (not renewed). This is referred to as churn.
You can view the churn rate either for all your apps or for specific apps.
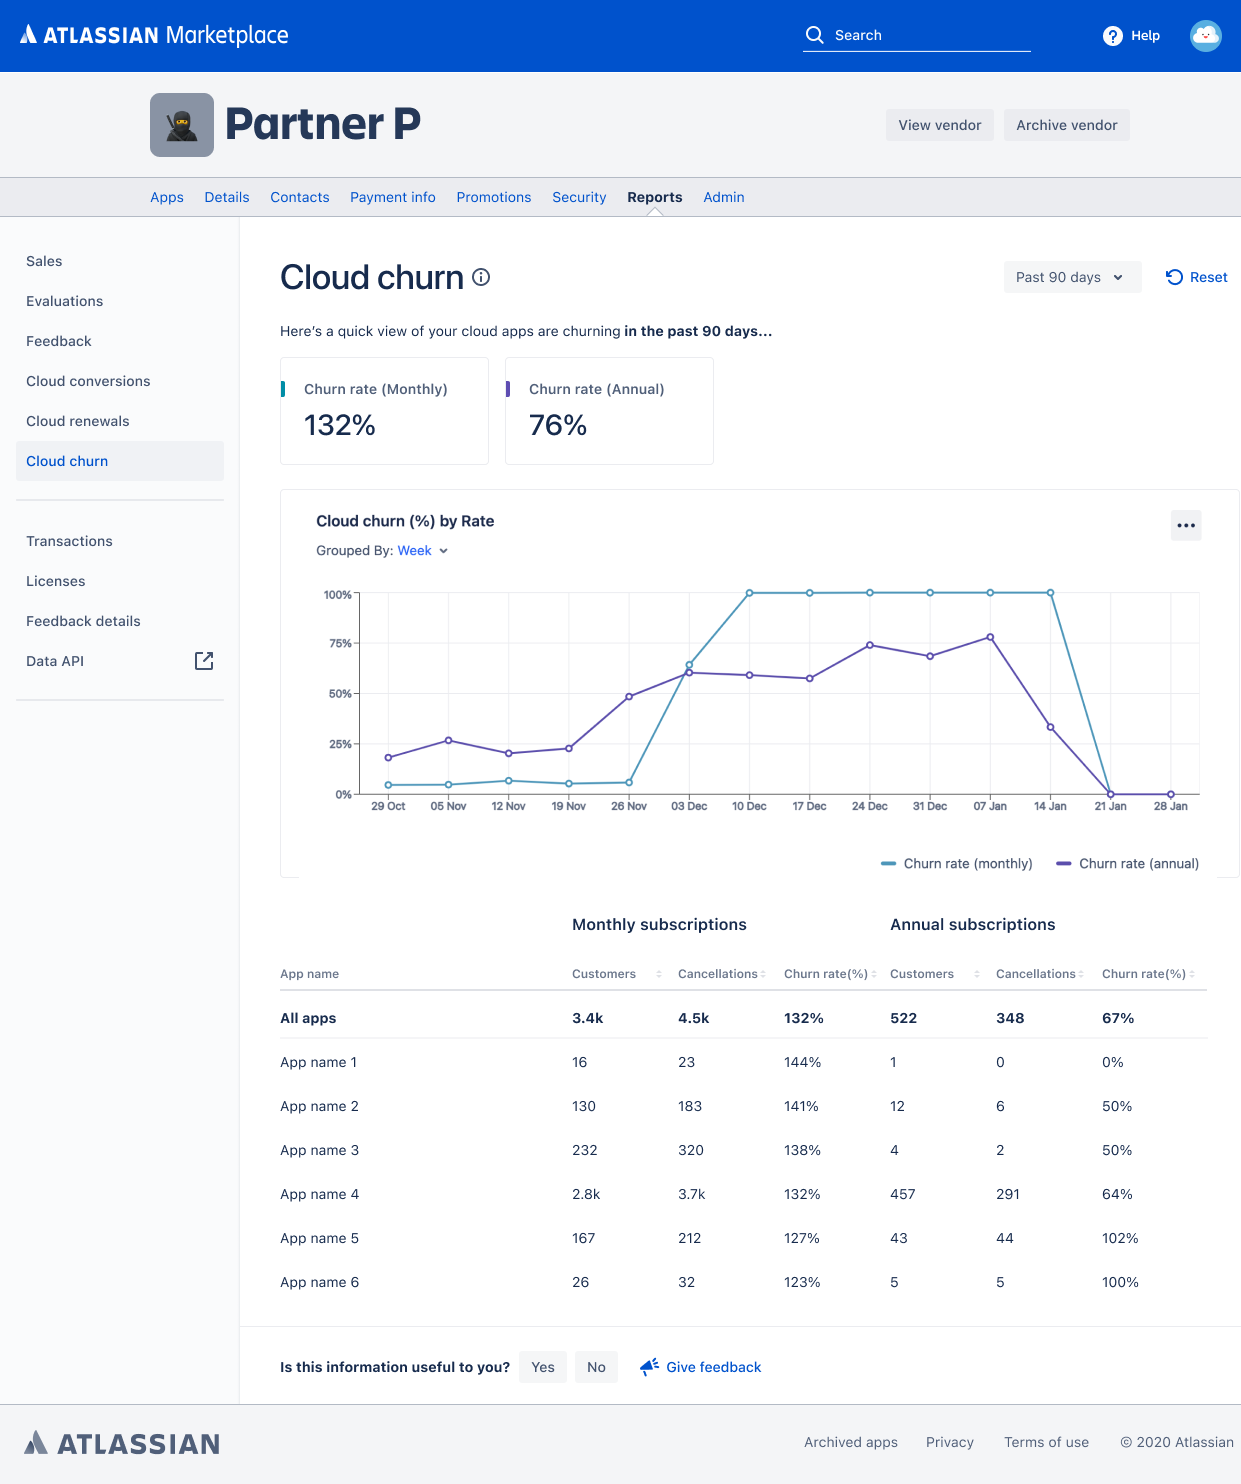
Filters
Filters offer different kinds of customizations. The date range filter provides multiple iterations to customize the dates. All the dates displayed are in UTC. These are your options:
- All dates
- Last 30 days
- Last 90 days
- This month to date
- Last month
- Year to date
- Last year
- Custom
Graph
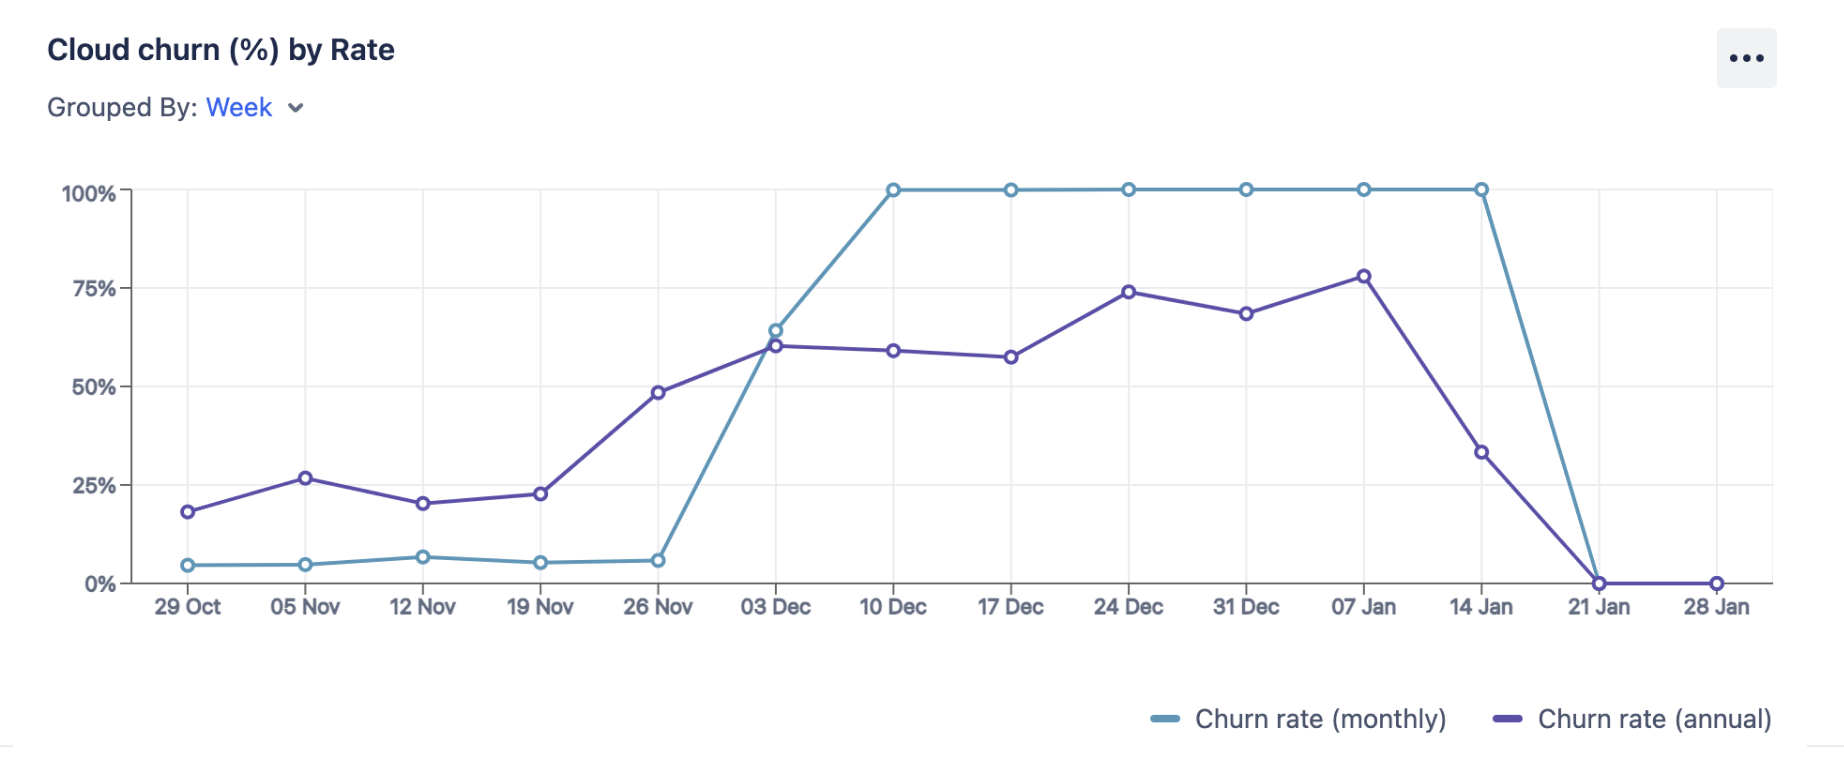
The cloud churn is charted on a time-series graph where the Y-axis is the churn rate. You can view the churn rate for both monthly and annual subscriptions. The graph depics the cloud churn based on the selected filter.
You can group the charts by week or month.
You can also toggle the chart patterns from the three dots on the top right and change them for better accessibility.
Table
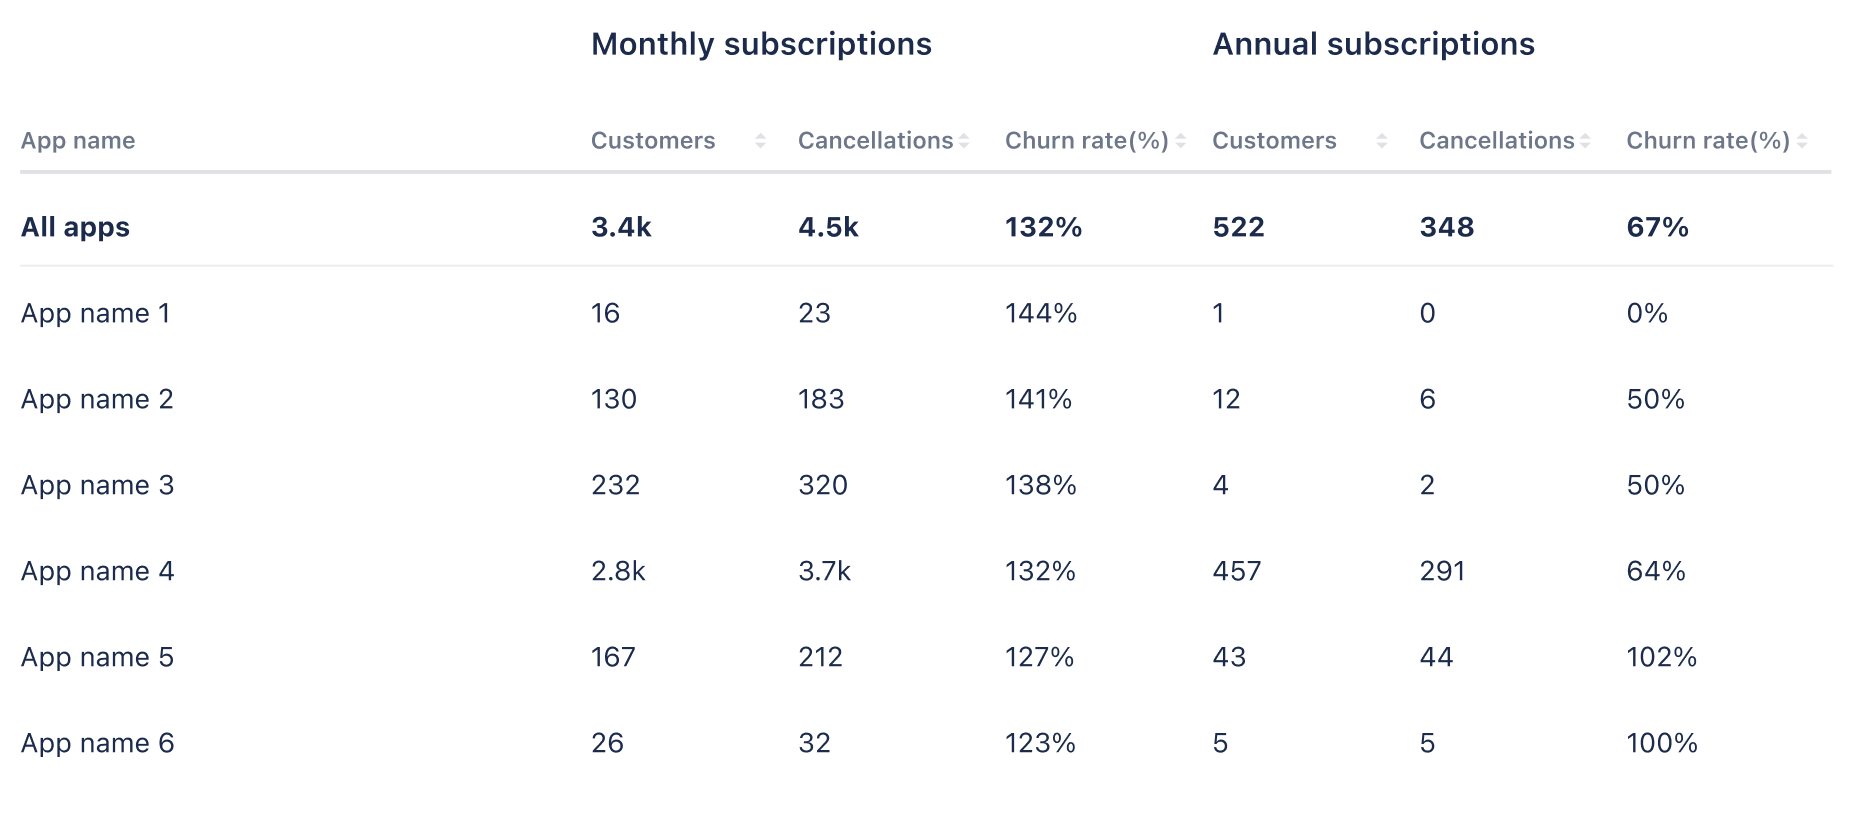
Within the table, your data is numerically displayed for all your apps as well as for specific apps.
You can see the number of customers at a particular point in time, the number of cancellations during that period and the churn rate. This can be viewed separately for monthly and annual subscriptions.
- Cloud churn: The number of licenses that were due to be renewed but were not renewed.
- Customers: The total number of customers in that specified time period.
- Cancellations: The number of licenses that were not renewed.
- Churn rate: (Number of licenses that were not renewed) / (Number of licenses due to be renewed) in the specified date range.
For information about other terms used in the reports, check out the glossary.
Rate this page: