Performance and scale testing your Data Center app
This page describes the performance and scale testing requirements for Data Center apps in the Atlassian Marketplace. Here, we provide guidelines for configuring an existing test platform to produce the test data we need to evaluate your app. For a general overview of Data Center app development, see Developing apps for Atlassian Data Center products.
Don’t have a test platform yet? We can help you set one up:
- Data Center App Performance Toolkit User Guide For Jira
- Data Center App Performance Toolkit User Guide For Jira Service Management
- Data Center App Performance Toolkit User Guide For Confluence
- Data Center App Performance Toolkit User Guide For Bitbucket
- Data Center App Performance Toolkit User Guide For Crowd
- Data Center App Performance Toolkit User Guide For Bamboo
Requirements
-
Going through the approval process for Atlassian Marketplace, requires executing performance tests on the host equivalent in its capacity to our Data Center customers' ones. The test environment is a crucial point that influences test results and shows off performance impact on the software itself. Hence, running performance suites will require a clustered test host with node configuration similar to AWS
m5.2xlargeinstance type (8 CPU core and 32 GB RAM). -
You're required to run tests with preloaded large dataset to your host. The base dataset must mimic the one that ships with the Data Center App Performance Toolkit. See the datasets outlined below.
Dataset requirements
| Product | Dataset reference |
|---|---|
| Jira | See the enterprise-scale dataset shape listed on Jira Data Center Load Profile. |
| Jira Service Management | See the enterprise-scale dataset shape listed on Jira Service Management Data Center Load Profile. |
| Confluence | See the enterprise-scale dataset shape listed on Confluence Data Center Load Profile. |
| Bitbucket | See the enterprise-scale dataset shape listed on Bitbucket Data Center Load Profile. |
| Crowd | See the enterprise-scale dataset shape listed on Crowd Data Center Load Profile. |
| Bamboo | See the enterprise-scale dataset shape listed on Bamboo Data Center Load Profile. |
-
You’re required to conduct performance testing on a 1 node DC instance, with and without your app installed.
You're required to test the main actions of the base product outlined below:
-
Jira: login, create work item, view work item, edit work item, view dashboard, view scrum board, view kanban board, add comment,JQL search, logout.
-
Jira Service Management: login, view request on portal, create request, view request for agent, edit request, view dashboard, add comment, add attachment, view queues, view reports, JQL search, logout.
-
Confluence: login, view page, edit page, create page, add comment to page, view blog, create blog, view dashboard, logout.
-
Bitbucket: git clone via ssh, git clone (via https/ssh), git fetch, git push (via ssh/https), git push (via https/ssh), login, create pull request, comment pull request, view branches, view dashboard, view repo, view project repos, logout.
-
Crowd: user authentication via crowd.
-
Bamboo: login, view plans, view plan results, view plan configuration, view plan history, start plans in parallel.
- You're required to conduct scale testing of your app. This means testing the same product baseload actions plus specific for your app endpoints and interfaces on the instance with additional 2 and 4 nodes configuration.
Concurrency requirements
We advise using the specified parameters to establish decent workload for all tests. The key values are outlined below:
Jira
-
total_actions_per_hour:54 500- number of total actions per hour. -
concurrency:200- number of concurrent users for scenario. -
test_duration:45m- duration of the performance run.
Jira Service Management
total_actions_per_hour_agents:5 000- number of total actions per hour for agents.total_actions_per_hour_customers:15 500- number of total actions per hour for agents.concurrency_agents:50- number of concurrent agents for scenario.concurrency_customers:150- number of concurrent users for scenario.test_duration:45m- duration of the performance run. o.
Confluence
total_actions_per_hour: 20 000- number of total actions per hour.concurrency: 200- number of concurrent virtual users for scenario.test_duration: 45m- duration of the performance run.
Bitbucket
total_actions_per_hour: 32 700- number of total actions per hour.concurrency: 20- number of concurrent virtual users for scenario.test_duration: 50m- duration of the performance run.
Crowd
concurrency: 1000- number of concurrent threads to authenticate random users.test_duration: 45m- duration of the performance run.
1 node scenario parameters
ramp-up: 20s- time to spin all concurrent threads.total_actions_per_hour: 180000- number of total JMeter actions per hour.
2 nodes scenario parameters
ramp-up: 10s- time to spin all concurrent threads.total_actions_per_hour: 360000- number of total JMeter actions per hour.
4 nodes scenario parameters
ramp-up: 5s- time to spin all concurrent threads.total_actions_per_hour: 720000- number of total JMeter actions per hour.
Bamboo
total_actions_per_hour: 2 000- number of total actions per hour.concurrency: 200- number of concurrent virtual users for scenario.test_duration: 45m- duration of the performance run.number_of_agents: 50- number of available remote agents.parallel_plans_count: 40- number of parallel plans execution.
Expected outputs
In order to pass the DC Apps approval process, you need to attach information that covers following points:
- performance regression report (CSV and graph)
- scale report (CSV and graph)
- explication about approach applied during testing (Framework,Testing Browser etc)
- list of the product default actions with their description
- elaboration on the app-specific action (determine its use case)
- specification of dataset dimensions used during testing
- information about load profile configurations
- performance runs execution logs
- CPU load graphs of cluster nodes of all runs
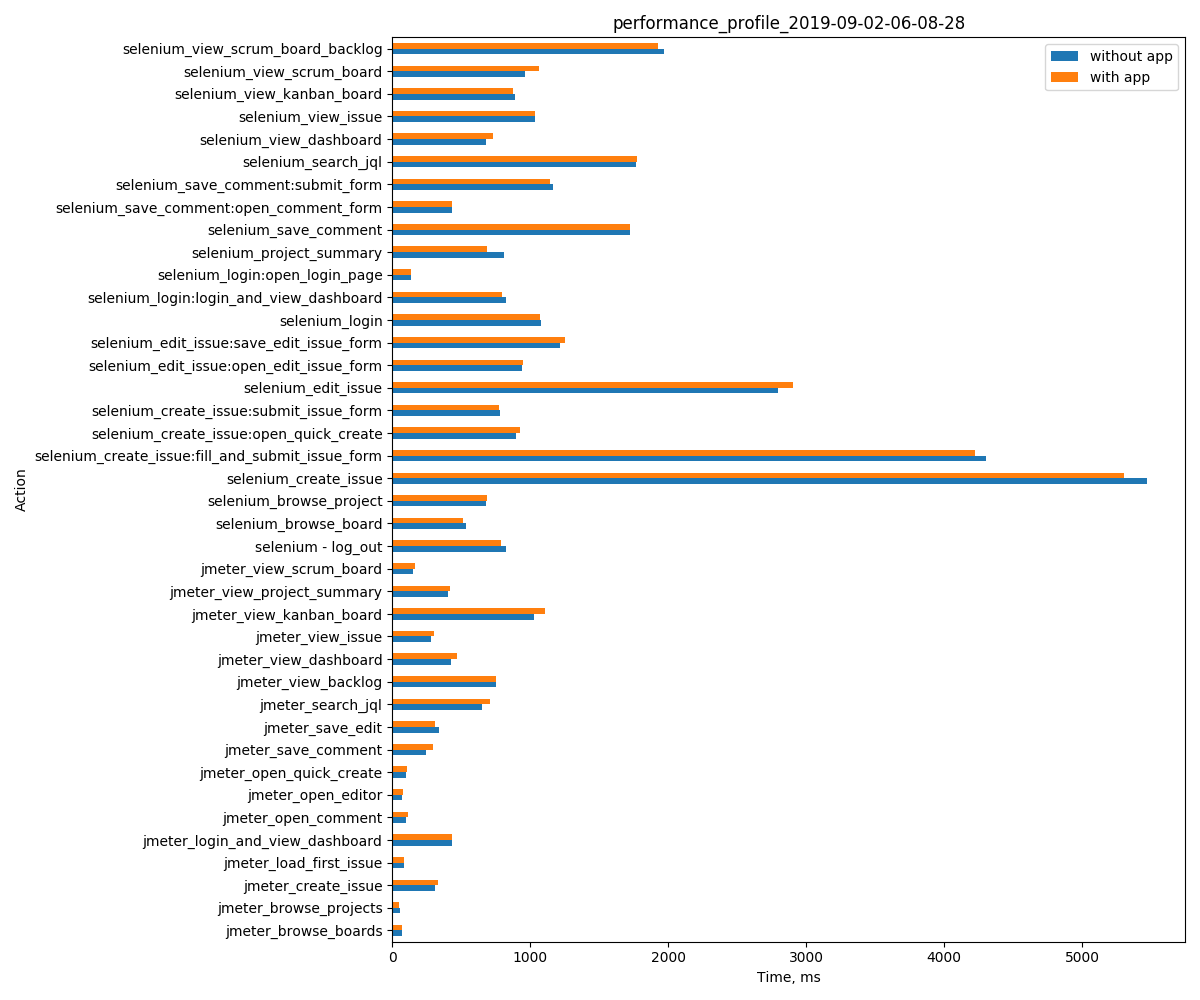
Performance regression report
This report should show the response time of each action for two deployments with and without the app installed.
Sample of performance regression reports
CSV
| Action | Without app (timing in ms) | With app (timing in ms) |
|---|---|---|
| view_scrum_board_backlog | 100 | 105 |
| view_scrum_board | 100 | 102 |
| ... | ... | ... |
Graph
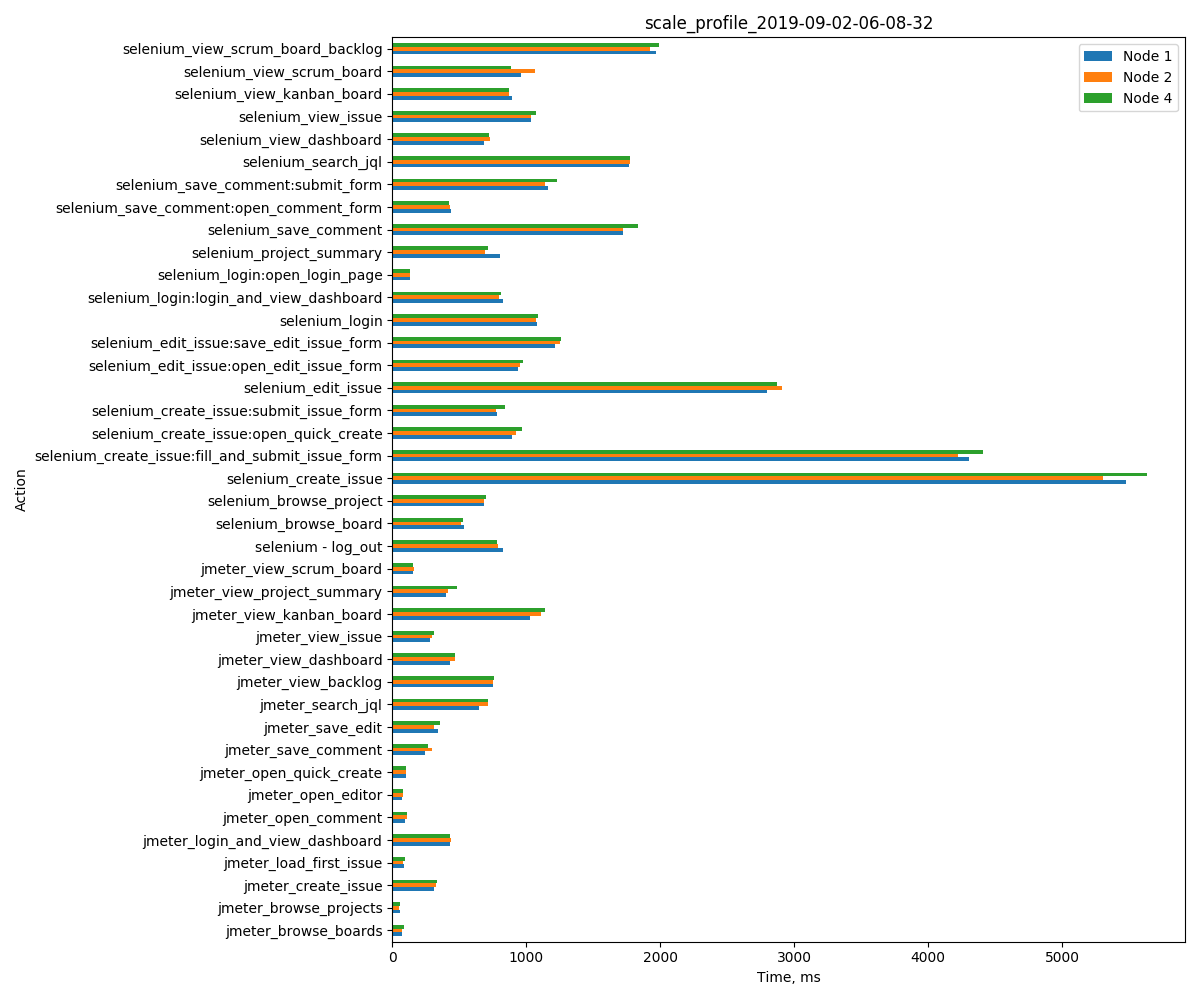
Scale report
The report should show the response time of each action on instances with one, two, and four application nodes.
Sample of scale reports
CSV
| Action | 1 node (timing in ms) | 2 nodes (timing in ms) | 4 nodes (timing in ms) |
|---|---|---|---|
| view_scrum_board_backlog | 100 | 102 | 110 |
| view_scrum_board | 500 | 535 | 530 |
| ... | ... | ... | ... |
Graph
Rate this page: