Data Center App Performance Toolkit User Guide For Jira
This document walks you through the process of testing your app on Jira using the Data Center App Performance Toolkit. These instructions focus on producing the required performance and scale benchmarks for your Data Center app.
Data Center App Performance Toolkit is focused on applications performance testing for Marketplace approval process. For Jira DataCenter functional testing consider JPT.
In this document, we cover the use of the Data Center App Performance Toolkit on two types of environments:
Development environment: Jira Data Center environment for a test run of Data Center App Performance Toolkit and development of app-specific actions.
- Set up a development environment Jira Data Center on AWS.
- Run toolkit on the development environment locally.
- Develop and test app-specific actions locally.
Enterprise-scale environment: Jira Data Center environment used to generate Data Center App Performance Toolkit test results for the Marketplace approval process.
- Set up an enterprise-scale environment Jira Data Center on AWS.
- Setting up load configuration for Enterprise-scale runs.
- Running the test scenarios from execution environment against enterprise-scale Jira Data Center.
Development environment
Running the tests in a development environment helps familiarize you with the toolkit. It'll also provide you with a lightweight and less expensive environment for developing app-specific actions. Once you're ready to generate test results for the Marketplace Data Center Apps Approval process, run the toolkit in an enterprise-scale environment.
1. Setting up Jira Data Center development environment
AWS cost estimation for the development environment
You are responsible for the cost of AWS services used while running this Terraform deployment. See Amazon EC2 pricing for more detail.
To reduce costs, we recommend you to keep your deployment up and running only during the performance runs. AWS Jira Data Center development environment infrastructure costs about 20 - 40$ per working week depending on such factors like region, instance type, deployment type of DB, and other.
Setup Jira Data Center development environment on k8s.
Jira Data Center development environment is good for app-specific actions development. But not powerful enough for performance testing at scale. See Set up an enterprise-scale environment Jira Data Center on AWS for more details.
Below process describes how to install low-tier Jira DC with "small" dataset included:
-
Create Access keys for AWS CLI:
Example Option 1 with Admin user:
- Go to AWS Console -> IAM service -> Users
- Create new user -> attach policies directly ->
AdministratorAccess - Open newly created user -> Security credentials tab -> Access keys -> Create access key -> Command Line Interface (CLI) -> Create access key
- Use
Access keyandSecret access keyin aws_envs file
Example Option 2 with granular Policies:
-
Go to AWS Console -> IAM service -> Policies
-
Create
policy1with json content of the policy1 fileImportant: change all occurrences of
123456789012to your real AWS Account ID. -
Create
policy2with json content of the policy2 fileImportant: change all occurrences of
123456789012to your real AWS Account ID. -
Go to User -> Create user -> Attach policies directly -> Attach
policy1andpolicy2-> Click on Create user button -
Open newly created user -> Security credentials tab -> Access keys -> Create access key -> Command Line Interface (CLI) -> Create access key
-
Use
Access keyandSecret access keyin aws_envs file
-
Clone Data Center App Performance Toolkit locally.
For annual review, always get the latest version of the DCAPT code from the master branch.
DCAPT supported versions: three latest minor version releases.
-
Navigate to
dc-app-performance-toolkit/app/util/k8sfolder. -
Set AWS access keys created in step1 in
aws_envsfile:AWS_ACCESS_KEY_IDAWS_SECRET_ACCESS_KEYAWS_SESSION_TOKEN(only for temporary creds)
-
Set required variables in
dcapt-small.tfvarsfile:-
environment_name- any name for you environment, e.g.dcapt-jira-small -
products-jira -
jira_license- one-liner of valid jira license without spaces and new line symbols -
region- AWS region for deployment. Do not change default region (us-east-2). If specific region is required, contact support.
If you don't have a license, you can request a trial one for DCAPT performance testing purposes via your open DC Annual Review ECOHELP ticket.
-
-
Optional variables to override:
jira_version_tag- Jira version to deploy. Supported versions see in README.md.
-
From local terminal (Git Bash for Windows users) start the installation (~20 min):
1 2
docker run --pull=always --env-file aws_envs \ -v "/$PWD/dcapt-small.tfvars:/data-center-terraform/conf.tfvars" \ -v "/$PWD/dcapt-snapshots.json:/data-center-terraform/dcapt-snapshots.json" \ -v "/$PWD/logs:/data-center-terraform/logs" \ -it atlassianlabs/terraform:2.9.23 ./install.sh -c conf.tfvars -
Copy product URL from the console output. Product url should look like
http://a1234-54321.us-east-2.elb.amazonaws.com/jira.
All the datasets use the standard admin/admin credentials.
2. Run toolkit on the development environment locally
Make sure English (United States) language is selected as a default language on the  > System > General configuration page. Other languages are not supported by the toolkit.
-
Clone Data Center App Performance Toolkit locally.
For annual review, always get the latest version of the DCAPT code from the master branch.
DCAPT supported versions: three latest minor version releases.
-
Follow the README.md instructions to set up toolkit locally.
-
Navigate to
dc-app-performance-toolkit/appfolder. -
Open the
jira.ymlfile and fill in the following variables:application_hostname: your_dc_jira_instance_hostname without protocol.application_protocol: http or https.application_port: for HTTP - 80, for HTTPS - 443, 8080, 2990 or your instance-specific port.secure: True or False. Default value is True. Set False to allow insecure connections, e.g. when using self-signed SSL certificate.application_postfix:/jira# e.g. /jira for TerraForm deployment url likehttp://a1234-54321.us-east-2.elb.amazonaws.com/jira. Leave this value blank for url without postfix.admin_login: admin user username.admin_password: admin user password.load_executor: executor for load tests. Valid options are jmeter (default) or locust.concurrency:2- number of concurrent JMeter/Locust users.test_duration:5m- duration of the performance run.ramp-up:3s- amount of time it will take JMeter or Locust to add all test users to test execution.total_actions_per_hour:5450- number of total JMeter/Locust actions per hour.WEBDRIVER_VISIBLE: visibility of Chrome browser during selenium execution (False is by default).
-
Run bzt.
1 2
bzt jira.yml -
Review the resulting table in the console log. All JMeter/Locust and Selenium actions should have 0+% success rate.
In case some actions have 0% success rate refer to the following logs indc-app-performance-toolkit/app/results/jira/YY-MM-DD-hh-mm-ssfolder:results_summary.log: detailed run summaryresults.csv: aggregated .csv file with all actions and timingsbzt.log: logs of the Taurus tool executionjmeter.*: logs of the JMeter tool executionlocust.*: logs of the Locust tool execution (in case you use Locust as load_executor in jira.yml)pytest.*: logs of Pytest-Selenium execution
On the local run with development environment default tests may be flaky due to limited resources of the development cluster and local network.
The only purpose of the development cluster is to develop app-specific actions.
Do not proceed with the next step if any action has 0% success rate. Ask support if above logs analysis did not help.
3. Develop and test app-specific action locally
Data Center App Performance Toolkit has its own set of default test actions for Jira Data Center: JMeter/Locust and Selenium for load and UI tests respectively.
App-specific action - action (performance test) you have to develop to cover main use cases of your application. Performance test should focus on the common usage of your application and not to cover all possible functionality of your app. For example, application setup screen or other one-time use cases are out of scope of performance testing.
- Define main use case of your app. Usually it is one or two main app use cases.
- Your app adds new UI elements in Jira Data Center - Selenium app-specific action has to be developed.
- Your app introduces new endpoint or extensively calls existing Jira Data Center API - JMeter/Locust app-specific actions has to be developed.
JMeter and Locust actions are interchangeable, so you could select the tool you prefer:
- JMeter - UI-based performance tool.
- Locust - code-based (Python requests library) performance tool.
We strongly recommend developing your app-specific actions on the development environment to reduce AWS infrastructure costs.
Custom dataset
You can filter your own app-specific issues for your app-specific actions.
- Create app-specific issues that have specific anchor in summary, e.g. AppIssue anchor and issues summaries like AppIssue1, AppIssue2, AppIssue3.
- Go to the search page of your Jira Data Center -
JIRA_URL/issues/?jql=and selectAdvanced. - Write JQL that filter just your issues from step 1, e.g.
summary ~ 'AppIssue*'. - Edit Jira configuration file
dc-app-performance-toolkit/app/jira.yml:custom_dataset_query:JQL from step 3.
Next time when you run toolkit, custom dataset issues will be stored to the dc-app-performance-toolkit/app/datasets/jira/custom-issues.csv with columns: issue_key, issue_id, project_key.
Example of app-specific Selenium action development with custom dataset
You develop an app that adds some additional fields to specific types of Jira issues. In this case, you should develop Selenium app-specific action:
- Create app-specific Jira issues with AppIssue anchor in summary: AppIssue1, AppIssue2, etc.
- Go to the search page of your Jira Data Center -
JIRA_URL/issues/?jql=and check if JQL is correct:summary ~ 'AppIssue*'. - Edit
dc-app-performance-toolkit/app/jira.ymlconfiguration file and setcustom_dataset_query: summary ~ 'AppIssue*'. - Extend example of app-specific action in
dc-app-performance-toolkit/app/extension/jira/extension_ui.py.
Code example. So, our test has to open app-specific issues and measure time to load of this app-specific issues. - If you need to run
app_speicifc_actionas specific user uncommentapp_specific_user_loginfunction in code example. Note, that in this casetest_1_selenium_custom_actionshould follow just beforetest_2_selenium_z_log_outaction. - In
dc-app-performance-toolkit/app/selenium_ui/jira_ui.py, review and uncomment the following block of code to make newly created app-specific actions executed:
1
2# def test_1_selenium_custom_action(webdriver, datasets, screen_shots):
#     app_specific_action(webdriver, datasets)
- Run toolkit with
bzt jira.ymlcommand to ensure that all Selenium actions includingapp_specific_actionare successful.
Example of app-specific Locust/JMeter action development
You develop an app that introduces new GET and POST endpoints in Jira Data Center. In this case, you should develop Locust or JMeter app-specific action.
Locust app-specific action development example
- Extend example of app-specific action in
dc-app-performance-toolkit/app/extension/jira/extension_locust.py, so that test will call the endpoint with GET request, parse response use these data to call another endpoint with POST request and measure response time.
Code example. - In
dc-app-performance-toolkit/app/jira.ymlsetload_executor: locustto makelocustas load executor. - Set desired execution percentage for
standalone_extension. Default value is0, which means thatstandalone_extensionaction will not be executed. Locust uses actions percentage as relative weights, so ifsome_action: 10andstandalone_extension: 20that means thatstandalone_extensionwill be called twice more.
Setstandalone_extensionweight in accordance with the expected frequency of your app use case compared with other base actions. - App-specific tests could be run (if needed) as a specific user. Use
@run_as_specific_user(username='specific_user_username', password='specific_user_password')decorator for that. - Run toolkit with
bzt jira.ymlcommand to ensure that all Locust actions includingapp_specific_actionare successful.
JMeter app-specific action development example
-
Check that
jira.ymlfile has correct settings ofapplication_hostname,application_protocol,application_port,application_postfix, etc. -
Set desired execution percentage for
standalone_extension. Default value is0, which means thatstandalone_extensionaction will not be executed. For example, for app-specific action development you could set percentage ofstandalone_extensionto 100 and for all other actions to 0 - this way onlylogin_and_view_dashboardandstandalone_extensionactions would be executed. -
Navigate to
dc-app-performance-toolkit/appfolder and follow start JMeter UI README:python util/jmeter/start_jmeter_ui.py --app jira -
Open
Jirathread group >actions per loginand navigate tostandalone_extension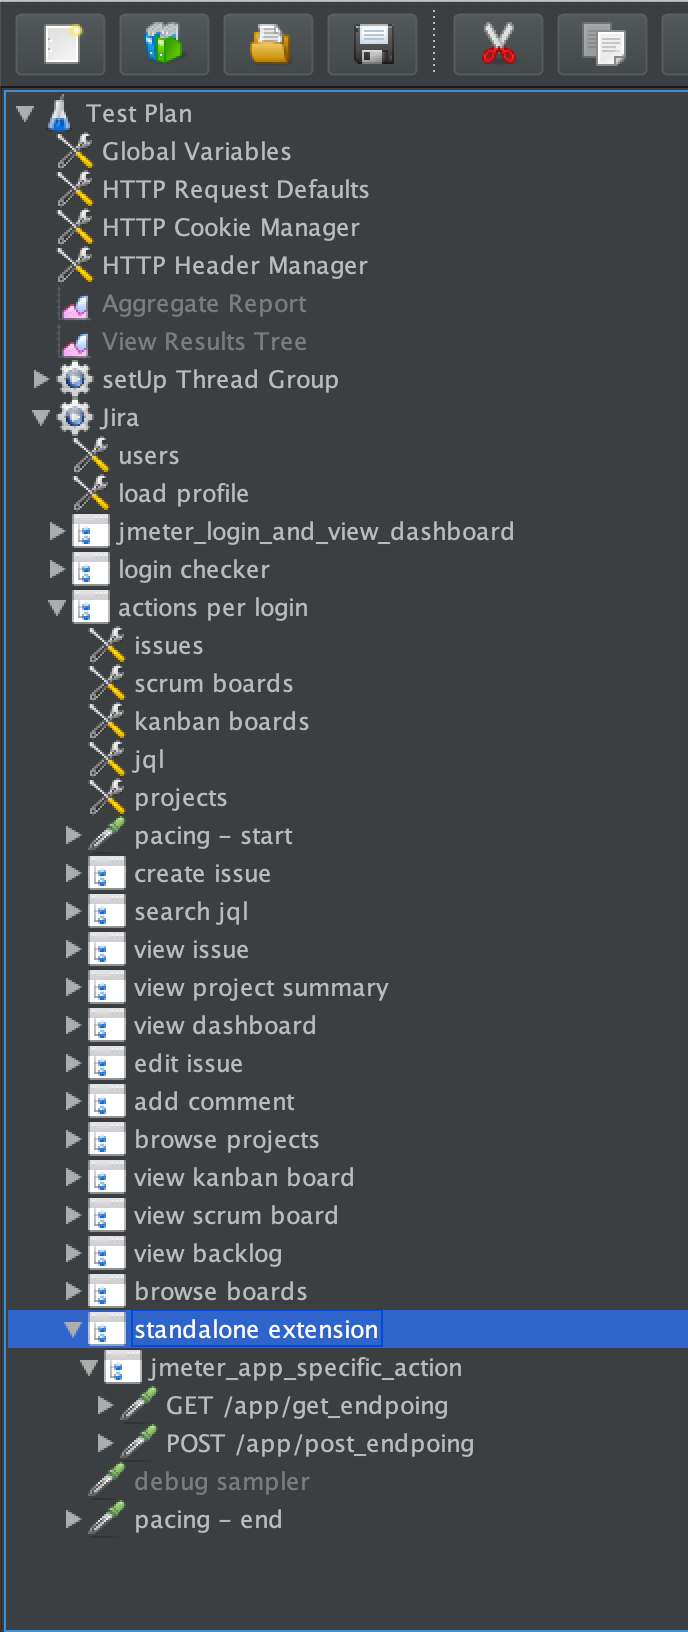
-
Add GET
HTTP Request: right-click tostandalone_extension>Add>SamplerHTTP Request, chose method GET and set endpoint in Path.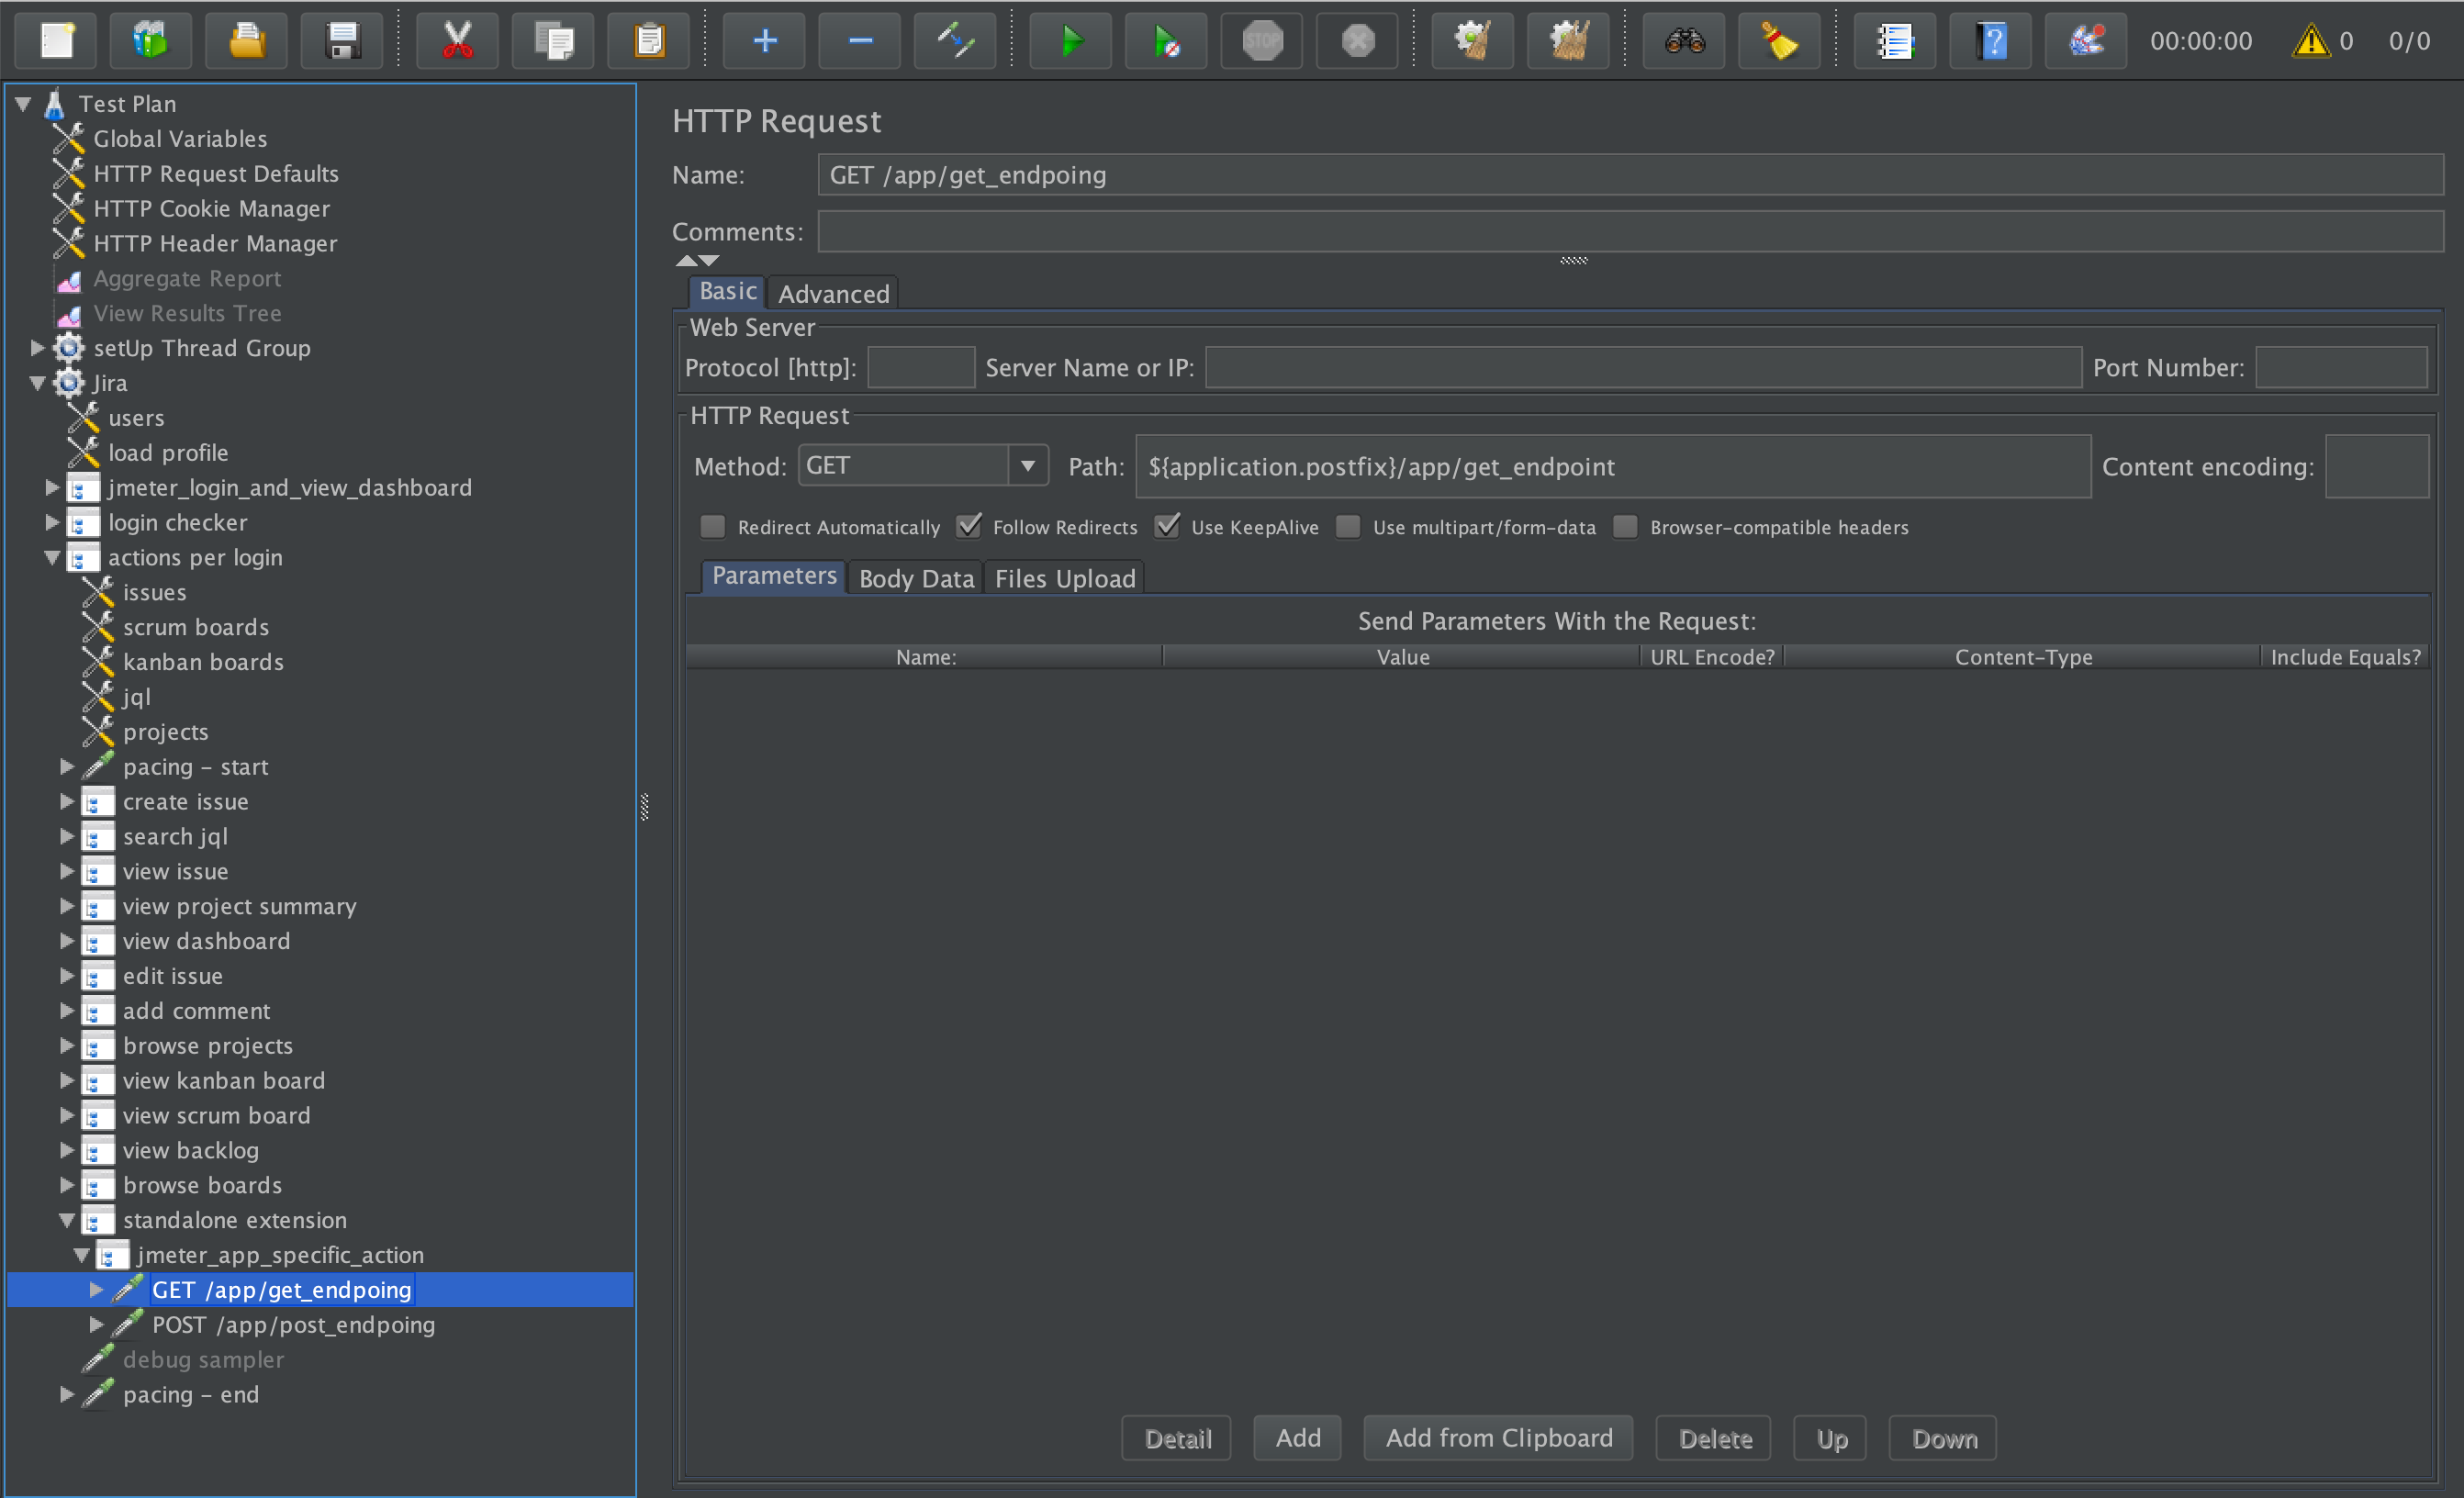
-
Add
Regular Expression Extractor: right-click to to newly createdHTTP Request>Add>Post processor>Regular Expression Extractor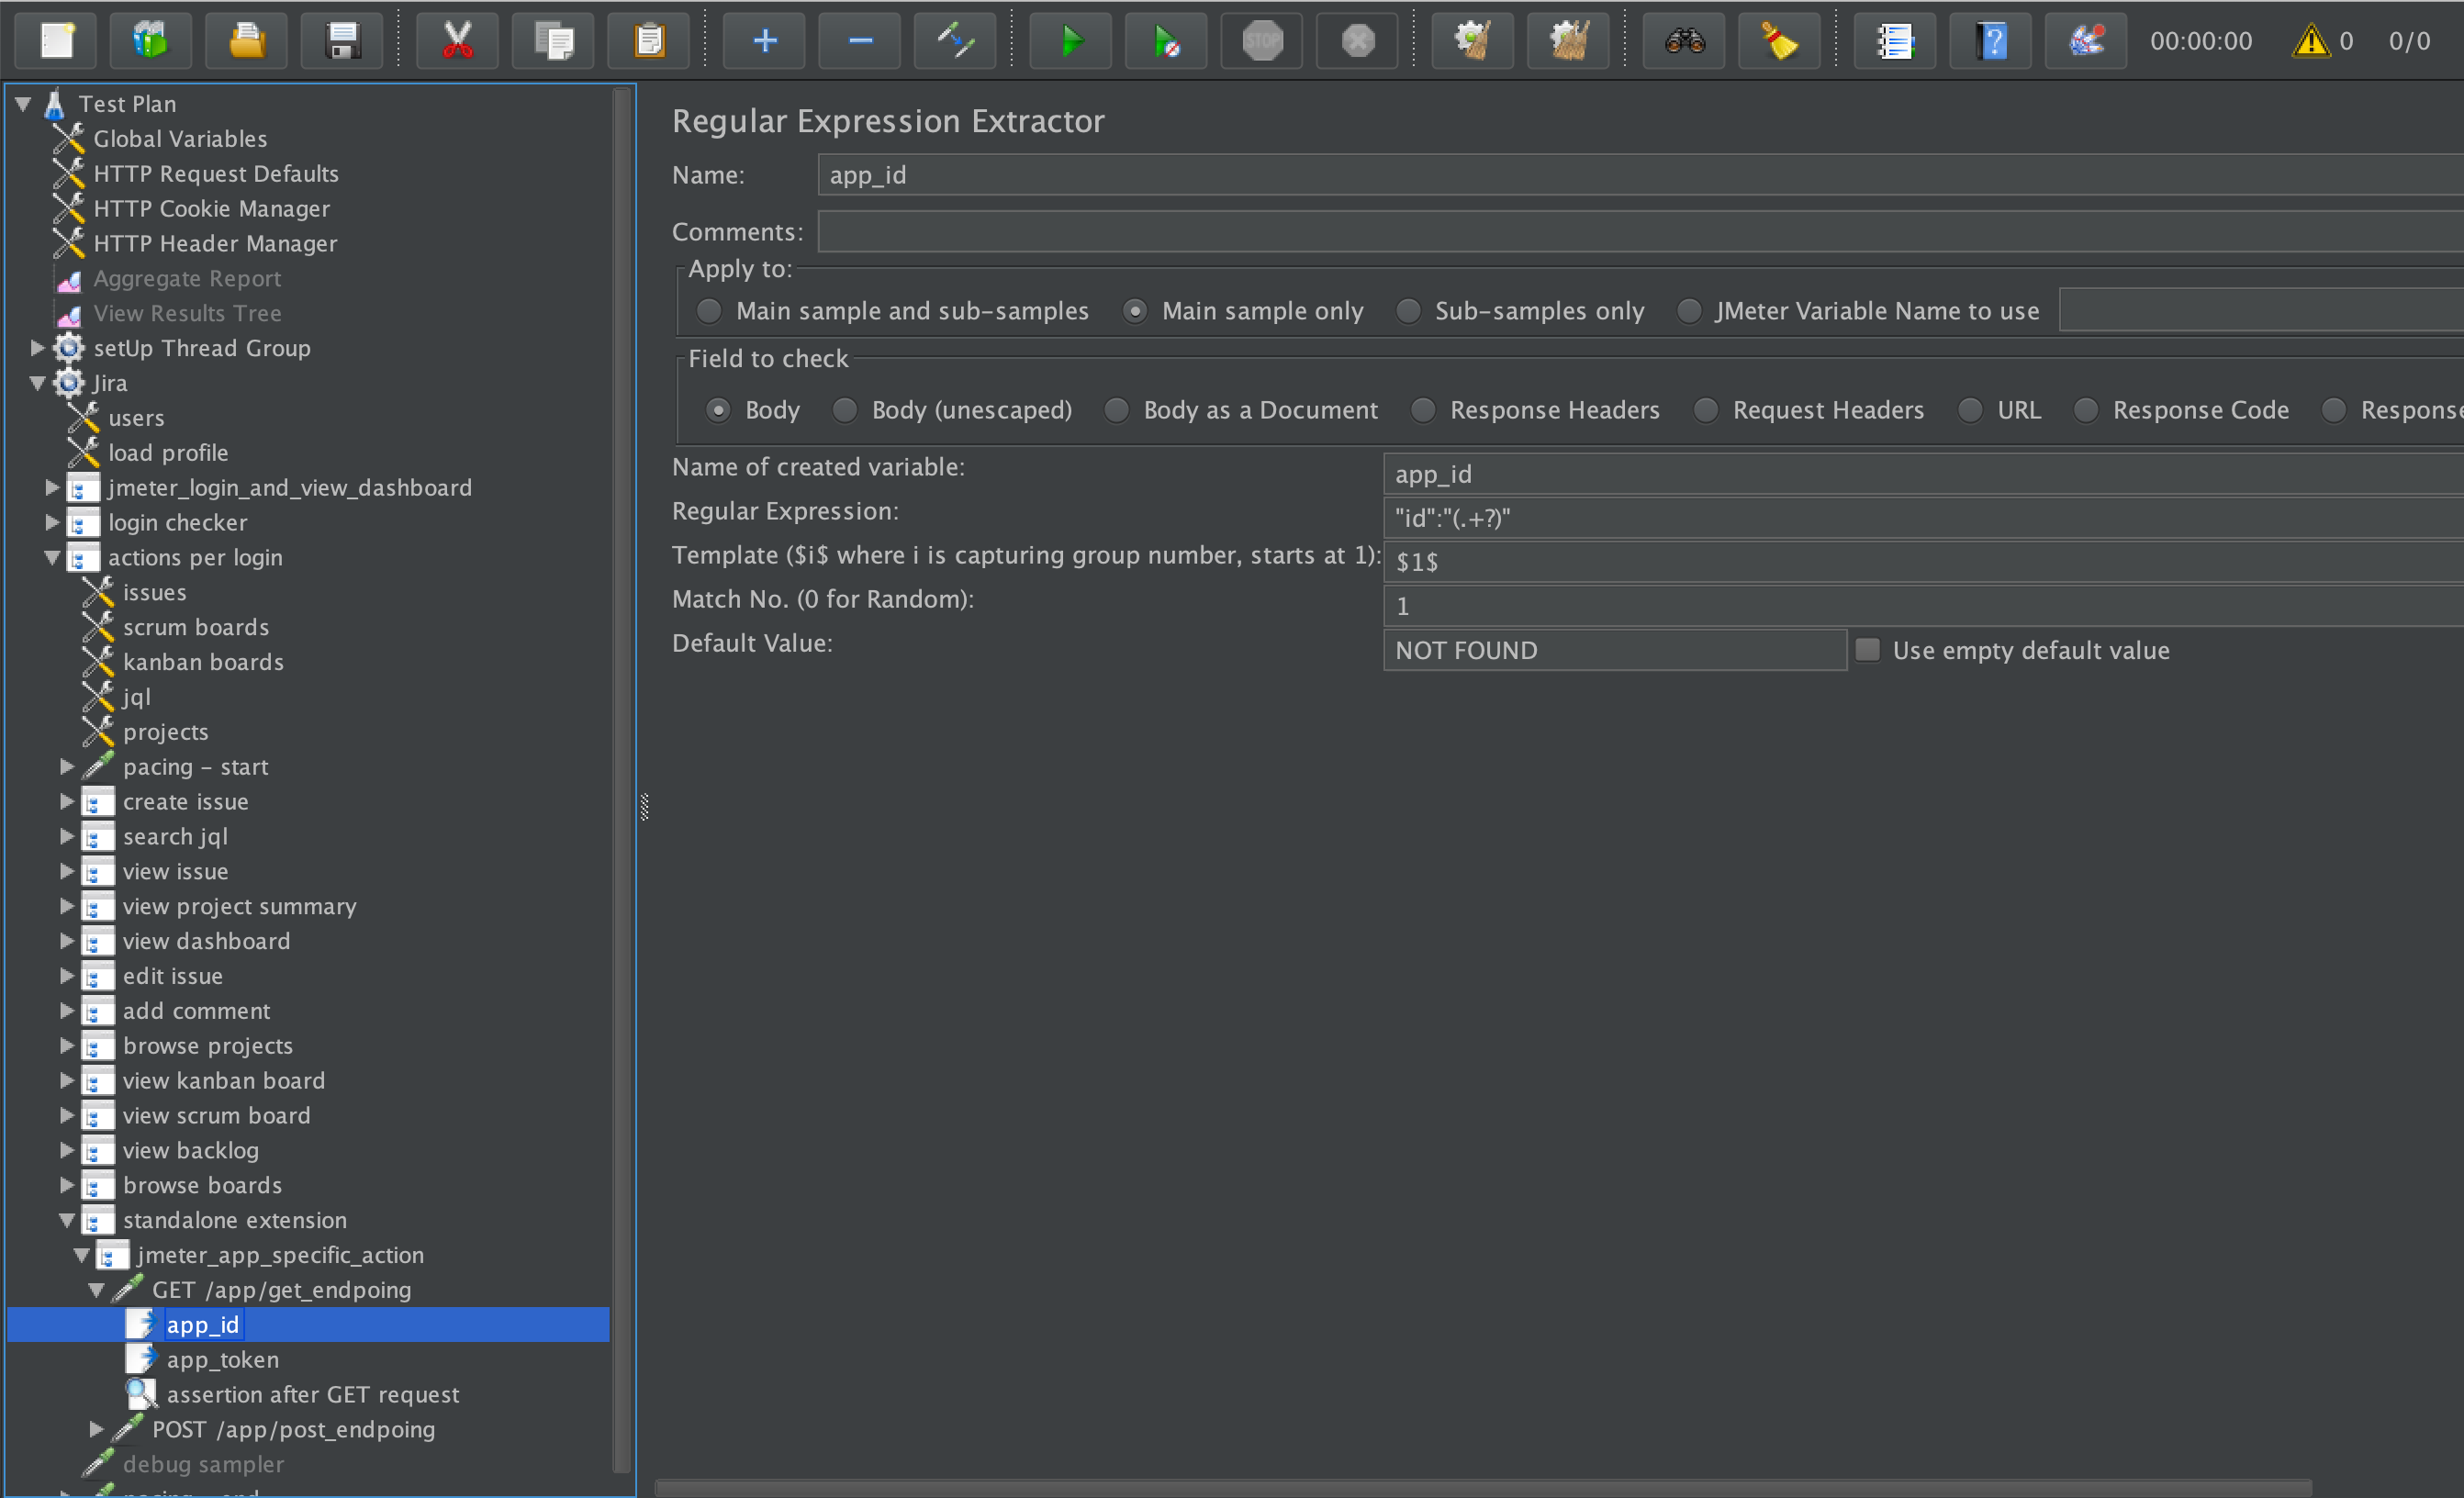
-
Add
Response Assertion: right-click to newly createdHTTP Request>Add>Assertions>Response Assertionand add assertion withContains,Matches,Equals, etc types.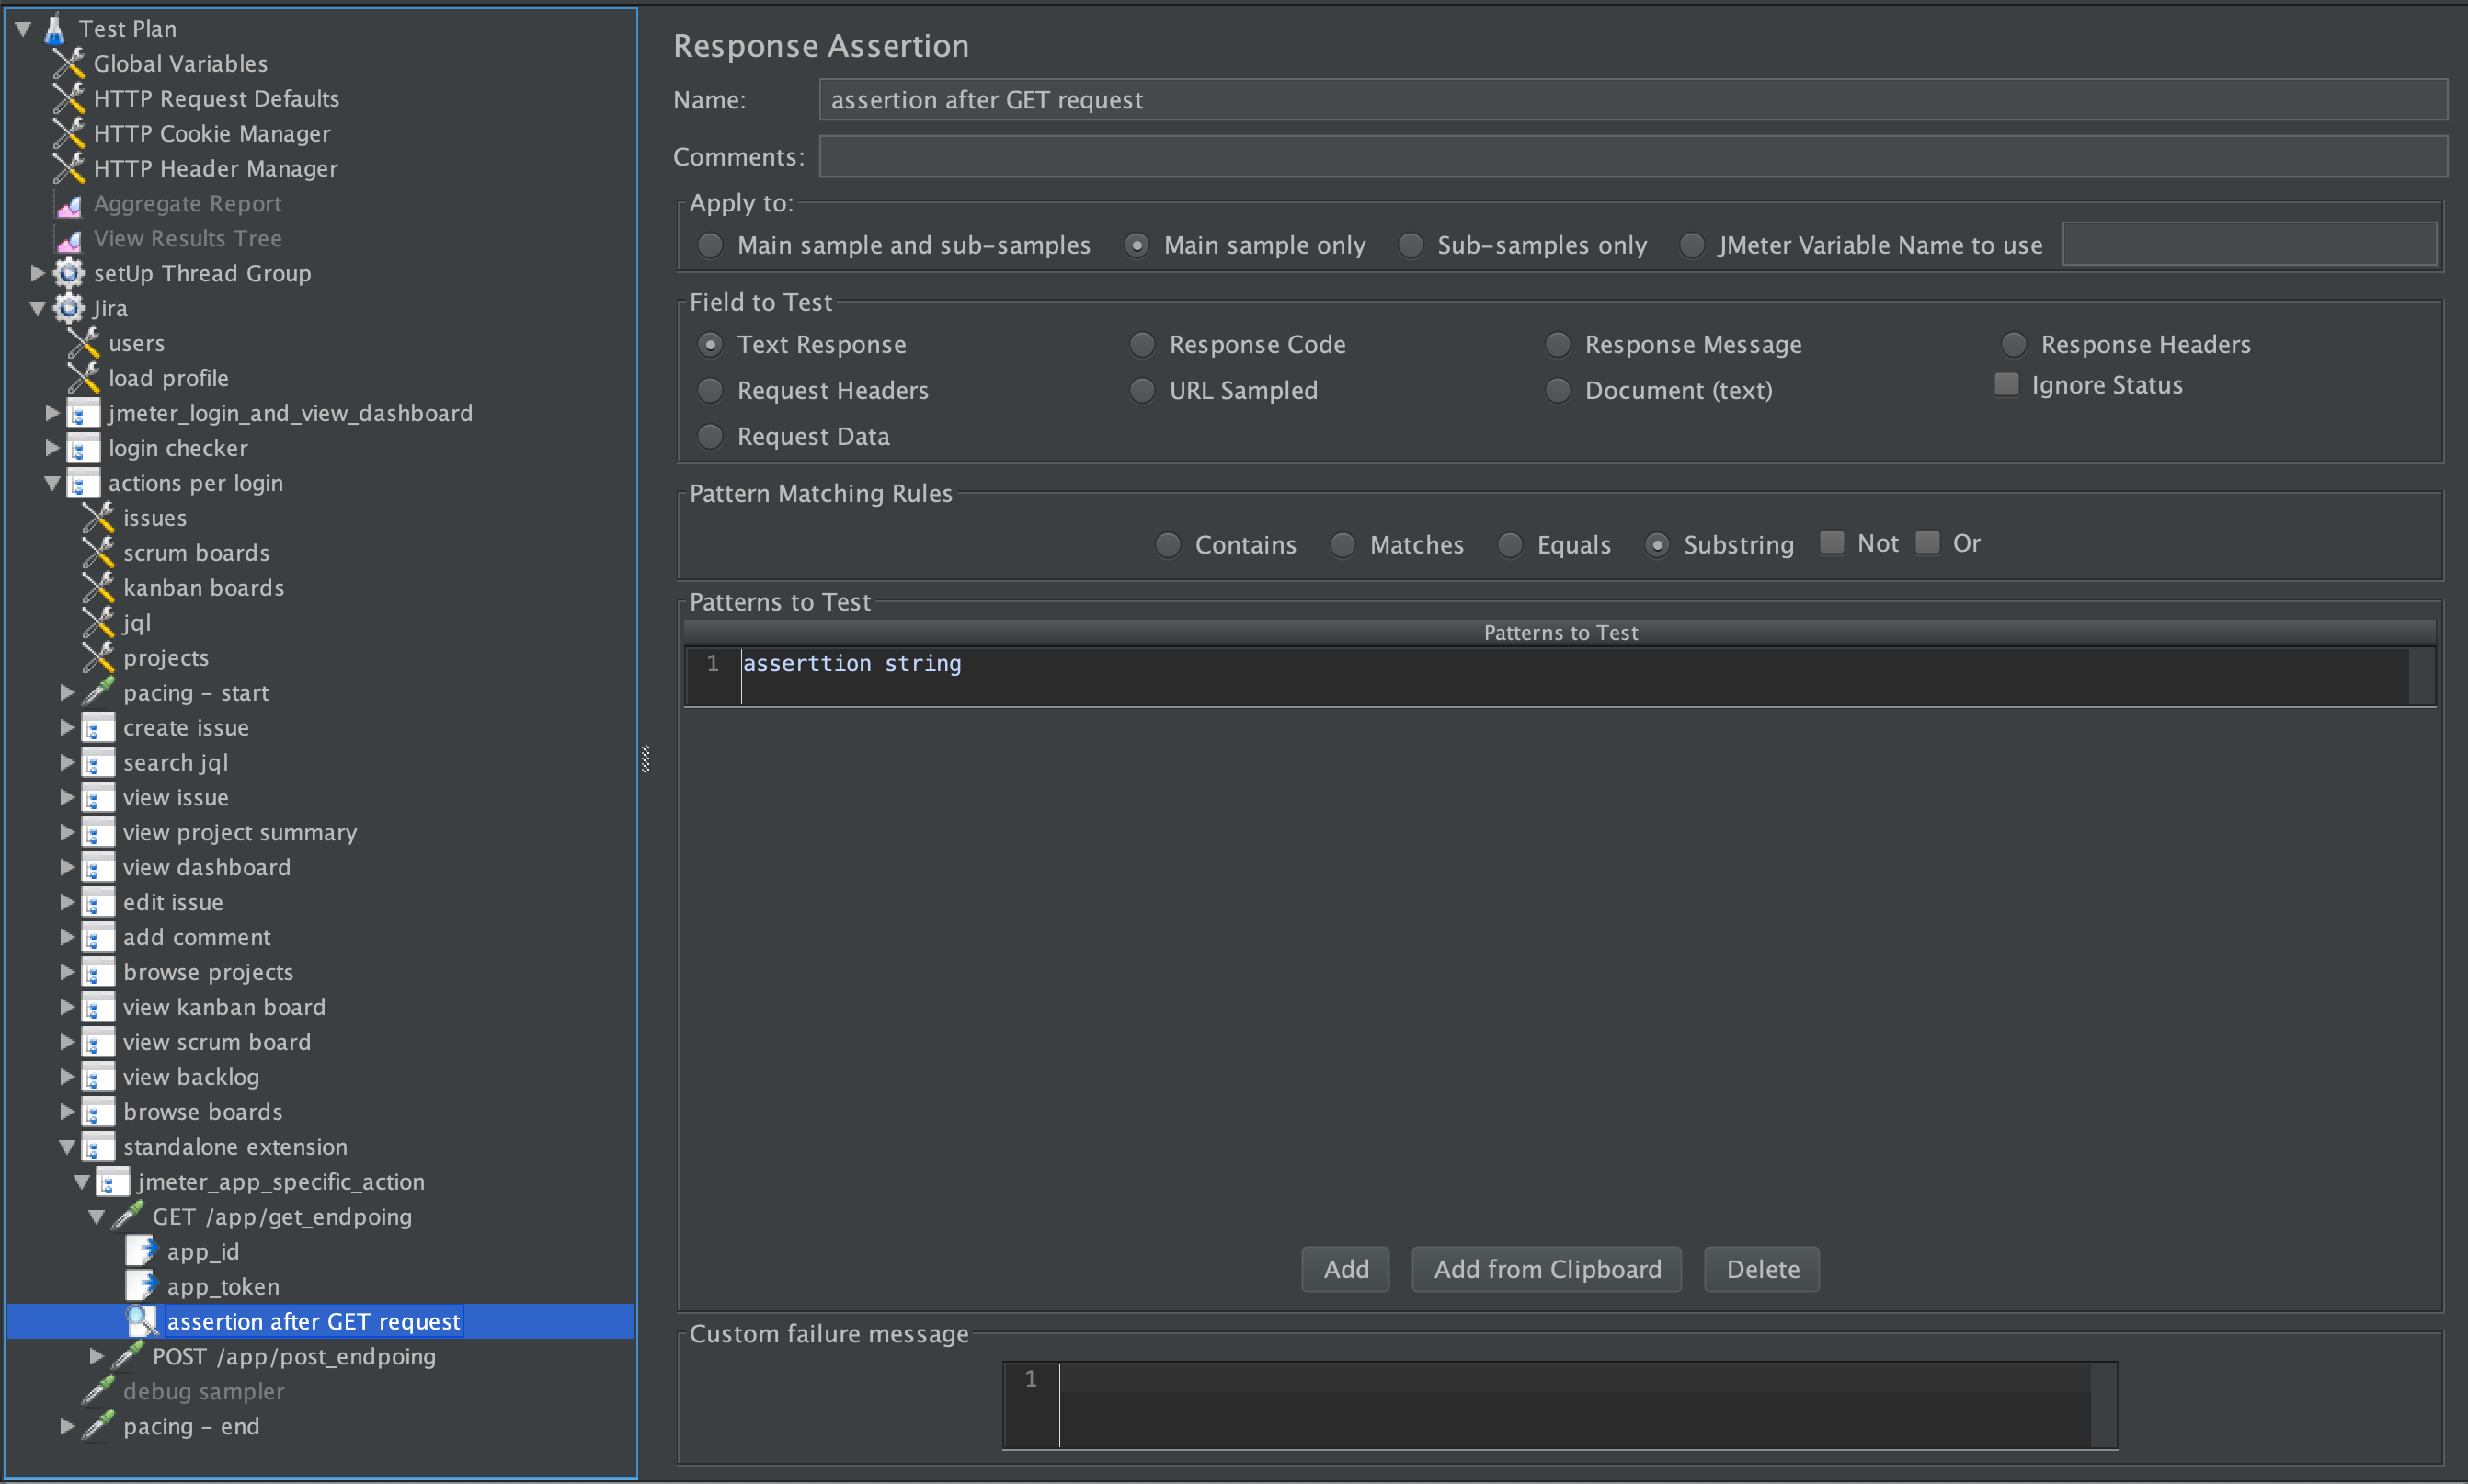
-
Add POST
HTTP Request: right-click tostandalone_extension>Add>SamplerHTTP Request, chose method POST, set endpoint in Path and add Parameters or Body Data if needed. -
Right-click on
View Results Treeand enable this controller. -
Click Start button and make sure that
login_and_view_dashboardandstandalone_extensionare successful. -
Right-click on
View Results Treeand disable this controller. It is important to disableView Results Treecontroller before full-scale results generation. -
Click Save button.
-
To make
standalone_extensionexecutable during toolkit run editdc-app-performance-toolkit/app/jira.ymland set execution percentage ofstandalone_extensionaccordingly to your use case frequency. -
App-specific tests could be run (if needed) as a specific user. In the
standalone_extensionuncommentlogin_as_specific_usercontroller. Navigate to theusername:passwordconfig element and update values forapp_specific_usernameandapp_specific_passwordnames with your specific user credentials. Also make sure that you located your app-specific tests betweenlogin_as_specific_userandlogin_as_default_user_if_specific_user_was_loggedincontrollers. -
Run toolkit to ensure that all JMeter actions including
standalone_extensionare successful.
Using JMeter variables from the base script
Use or access the following variables in your standalone_extension script if needed.
${issue_key}- issue key being viewed or modified (e.g. ABC-123)${issue_id}- issue id being viewed or modified (e.g. 693484)${project_key}- project key being viewed or modified (e.g. ABC)${project_id}- project id being viewed or modified (e.g. 3423)${scrum_board_id}- scrum board id being viewed (e.g. 328)${kanban_board_id}- kanban board id being viewed (e.g. 100)${jql}- jql query being used (e.g. text ~ "qrk*" order by key)${username}- the logged in username (e.g. admin)
App-specific actions are required. Do not proceed with the next step until you have completed app-specific actions development and got successful results from toolkit run.
Enterprise-scale environment
It is recommended to terminate a development environment before creating an enterprise-scale environment. Follow Terminate development environment instructions. In case of any problems with uninstall use Force terminate command.
After adding your custom app-specific actions, you should now be ready to run the required tests for the Marketplace Data Center Apps Approval process. To do this, you'll need an enterprise-scale environment.
4. Setting up Jira Data Center enterprise-scale environment with "large" dataset
EC2 CPU Limit
The installation of 4-pods DC environment and execution pod requires at least 40 vCPU Cores. Newly created AWS account often has vCPU limit set to low numbers like 5 vCPU per region. Check your account current vCPU limit for On-Demand Standard instances by visiting AWS Service Quotas page. Applied quota value is the current CPU limit in the specific region.
Make that current region limit is large enough to deploy new cluster. The limit can be increased by using Request increase at account-level button: choose a region, set a quota value which equals a required number of CPU Cores for the installation and press Request button. Recommended limit is 50.
AWS cost estimation
AWS Pricing Calculator provides an estimate of usage charges for AWS services based on certain information you provide. Monthly charges will be based on your actual usage of AWS services and may vary from the estimates the Calculator has provided.
*The prices below are approximate and may vary depending on such factors like region, instance type, deployment type of DB, and other.
| Stack | Estimated hourly cost ($) |
|---|---|
| One pod Jira DC | 1 - 2 |
| Two pods Jira DC | 1.5 - 2 |
| Four pods Jira DC | 2.0 - 3.0 |
Setup Jira Data Center enterprise-scale environment on k8s
Data dimensions and values for an enterprise-scale dataset are listed and described in the following table.
| Data dimensions | Value for an enterprise-scale dataset |
|---|---|
| Attachments | ~2 000 000 |
| Comments | ~6 000 000 |
| Components | ~2 500 |
| Custom fields | ~800 |
| Groups | ~1 000 |
| Issue security levels | 10 |
| Issue types | ~300 |
| Issues | ~1 000 000 |
| Priorities | 5 |
| Projects | 500 |
| Resolutions | 34 |
| Screen schemes | ~200 |
| Screens | ~200 |
| Statuses | ~400 |
| Users | ~21 000 |
| Versions | ~20 000 |
| Workflows | 50 |
All the datasets use the standard admin/admin credentials.
Below process describes how to install enterprise-scale Jira DC with "large" dataset included:
-
Create Access keys for AWS CLI:
Example Option 1 with Admin user:
- Go to AWS Console -> IAM service -> Users
- Create new user -> attach policies directly ->
AdministratorAccess - Open newly created user -> Security credentials tab -> Access keys -> Create access key -> Command Line Interface (CLI) -> Create access key
- Use
Access keyandSecret access keyin aws_envs file
Example Option 2 with granular Policies:
-
Go to AWS Console -> IAM service -> Policies
-
Create
policy1with json content of the policy1 fileImportant: change all occurrences of
123456789012to your real AWS Account ID. -
Create
policy2with json content of the policy2 fileImportant: change all occurrences of
123456789012to your real AWS Account ID. -
Go to User -> Create user -> Attach policies directly -> Attach
policy1andpolicy2-> Click on Create user button -
Open newly created user -> Security credentials tab -> Access keys -> Create access key -> Command Line Interface (CLI) -> Create access key
-
Use
Access keyandSecret access keyin aws_envs file
-
Clone Data Center App Performance Toolkit locally.
For annual review, always get the latest version of the DCAPT code from the master branch.
DCAPT supported versions: three latest minor version releases.
-
Navigate to
dc-app-performance-toolkit/app/util/k8sfolder. -
Set AWS access keys created in step1 in
aws_envsfile:AWS_ACCESS_KEY_IDAWS_SECRET_ACCESS_KEYAWS_SESSION_TOKEN(only for temporary creds)
-
Set required variables in
dcapt.tfvarsfile:-
environment_name- any name for you environment, e.g.dcapt-jira -
products-jira -
jira_license- one-liner of valid jira license without spaces and new line symbols -
region- AWS region for deployment. Do not change default region (us-east-2). If specific region is required, contact support.
If you don't have a license, you can request a trial one for DCAPT performance testing purposes via your open DC Annual Review ECOHELP ticket.
-
-
Optional variables to override:
jira_version_tag- Jira version to deploy. Supported versions see in README.md.
-
From local terminal (Git Bash for Windows users) start the installation (~20 min):
1 2
docker run --pull=always --env-file aws_envs \ -v "/$PWD/dcapt.tfvars:/data-center-terraform/conf.tfvars" \ -v "/$PWD/dcapt-snapshots.json:/data-center-terraform/dcapt-snapshots.json" \ -v "/$PWD/logs:/data-center-terraform/logs" \ -it atlassianlabs/terraform:2.9.23 ./install.sh -c conf.tfvars -
Copy product URL from the console output. Product url should look like
http://a1234-54321.us-east-2.elb.amazonaws.com/jira.
All the datasets use the standard admin/admin credentials.
It's recommended to change default password from UI account page for security reasons.
5. Setting up load configuration for Enterprise-scale runs
Default TerraForm deployment configuration
already has a dedicated execution environment pod to run tests from. For more details see Execution Environment Settings section in dcapt.tfvars file.
-
Check the
jira.ymlconfiguration file. If load configuration settings were changed for dev runs, make sure parameters were changed back to the defaults:1 2
application_hostname: test_jira_instance.atlassian.com # Jira DC hostname without protocol and port e.g. test-jira.atlassian.com or localhost application_protocol: http # http or https application_port: 80 # 80, 443, 8080, 2990, etc secure: True # Set False to allow insecure connections, e.g. when using self-signed SSL certificate application_postfix: /jira # e.g. /jira for TerraForm deployment url like `http://a1234-54321.us-east-2.elb.amazonaws.com/jira`. Leave this value blank for url without postfix. admin_login: admin admin_password: admin load_executor: jmeter # jmeter and locust are supported. jmeter by default. concurrency: 200 # number of concurrent virtual users for jmeter or locust scenario test_duration: 45m ramp-up: 3m # time to spin all concurrent users total_actions_per_hour: 54500 # number of total JMeter/Locust actions per hour
You'll need to run the toolkit for each test scenario in the next section.
6. Running the test scenarios from execution environment pod against enterprise-scale Jira Data Center
Using the Data Center App Performance Toolkit for Performance and scale testing your Data Center app involves two test scenarios:
Each scenario will involve multiple test runs. The following subsections explain both in greater detail.
Scenario 1: Performance regression
This scenario helps to identify basic performance issues without a need to spin up a multi-node Jira DC. Make sure the app does not have any performance impact when it is not exercised.
Run 1 (~50 min)
To receive performance baseline results without an app installed:
-
Before run:
- Make sure
jira.ymland toolkit code base has default configuration from themasterbranch. - Check load configuration parameters needed for enterprise-scale run: Setting up load configuration for Enterprise-scale runs.
- Check correctness of
application_hostname,application_protocol,application_portandapplication_postfixin .yml file. standalone_extensionset to 0. App-specific actions are not needed for Run1 and Run2.- AWS access keys set in
./dc-app-performance-toolkit/app/util/k8s/aws_envsfile:AWS_ACCESS_KEY_IDAWS_SECRET_ACCESS_KEYAWS_SESSION_TOKEN(only for temporary creds)
- Make sure
-
Navigate to
dc-app-performance-toolkitfolder and start tests execution:1 2
export ENVIRONMENT_NAME=your_environment_name1 2
docker run --pull=always --env-file ./app/util/k8s/aws_envs \ -e REGION=us-east-2 \ -e ENVIRONMENT_NAME=$ENVIRONMENT_NAME \ -v "/$PWD:/data-center-terraform/dc-app-performance-toolkit" \ -v "/$PWD/app/util/k8s/bzt_on_pod.sh:/data-center-terraform/bzt_on_pod.sh" \ -it atlassianlabs/terraform:2.9.23 bash bzt_on_pod.sh jira.yml -
View the results files of the run in the local
dc-app-performance-toolkit/app/results/jira/YY-MM-DD-hh-mm-ssfolder:results_summary.log: detailed run summaryresults.csv: aggregated .csv file with all actions and timingsbzt.log: logs of the Taurus tool executionjmeter.*: logs of the JMeter tool executionpytest.*: logs of Pytest-Selenium execution
Review results_summary.log file under artifacts dir location. Make sure that overall status is OK before moving to the next steps. For an enterprise-scale environment run, the acceptable success rate for actions is 95% and above.
Run 2 (~50 min + Lucene Index timing test)
If you are submitting a Jira app, you are required to conduct a Lucene Index timing test. This involves conducting a foreground re-index on a single-node Data Center deployment (with your app installed) and a dataset that has 1M issues.
The re-index time for Jira is about ~50-70 minutes.
Benchmark your re-index time with your app installed:
-
Install the app you want to test.
-
Setup app license.
-
Go to
> System > Indexing. -
Select the Full re-index option.
-
Click Re-Index and wait until re-indexing is completed.
Jira will be temporarily unavailable during the re-indexing process - "503 Service Temporarily Unavailable" message will be displayed. Once the process is complete, the system will be fully accessible and operational once again.
-
Take a screenshot of the acknowledgment screen displaying the re-index time and Lucene index timing.
Re-index information window is displayed on the Indexing page. If the window is not displayed, log in to Jira one more time and navigate to
> System > Indexing. If you use the direct link to the Indexing page, refresh the page after the re-index is finished. -
Attach the screenshot(s) to your ECOHELP ticket.
Performance results generation with the app installed (still use master branch):
-
Navigate to
dc-app-performance-toolkitfolder and start tests execution:1 2
export ENVIRONMENT_NAME=your_environment_name1 2
docker run --pull=always --env-file ./app/util/k8s/aws_envs \ -e REGION=us-east-2 \ -e ENVIRONMENT_NAME=$ENVIRONMENT_NAME \ -v "/$PWD:/data-center-terraform/dc-app-performance-toolkit" \ -v "/$PWD/app/util/k8s/bzt_on_pod.sh:/data-center-terraform/bzt_on_pod.sh" \ -it atlassianlabs/terraform:2.9.23 bash bzt_on_pod.sh jira.yml
Review results_summary.log file under artifacts dir location. Make sure that overall status is OK before moving to the next steps. For an enterprise-scale environment run, the acceptable success rate for actions is 95% and above.
Generating a performance regression report
To generate a performance regression report:
- Edit the
./app/reports_generation/performance_profile.ymlfile: - Navigate locally to
dc-app-performance-toolkitfolder and run the following command from local terminal (Git Bash for Windows users) to generate reports:1 2
docker run --pull=always \ -v "/$PWD:/dc-app-performance-toolkit" \ --workdir="//dc-app-performance-toolkit/app/reports_generation" \ --entrypoint="python" \ -it atlassian/dcapt csv_chart_generator.py performance_profile.yml - In the
./app/results/reports/YY-MM-DD-hh-mm-ssfolder, view the.csvfile (with consolidated scenario results), the.pngchart file and performance scenario summary report. If you see an impact (>20%) on any action timing, we recommend taking a look into the app implementation to understand the root cause of this delta.
Scenario 2: Scalability testing
The purpose of scalability testing is to reflect the impact on the customer experience when operating across multiple nodes. For this, you have to run scale testing on your app.
For many apps and extensions to Atlassian products, there should not be a significant performance difference between operating on a single node or across many nodes in Jira DC deployment. To demonstrate performance impacts of operating your app at scale, we recommend testing your Jira DC app in a cluster.
Run 3 (~50 min)
To receive scalability benchmark results for one-node Jira DC with app-specific actions:
-
Before run:
- Make sure
jira.ymland toolkit code base has code base with your developed app-specific actions. - Check correctness of
application_hostname,application_protocol,application_portandapplication_postfixin .yml file. - Check load configuration parameters needed for enterprise-scale run: Setting up load configuration for Enterprise-scale runs.
standalone_extensionset to non 0 and .jmx file has standalone actions implementation in case of JMeter app-specific actions.- test_1_selenium_custom_action is uncommented and has implementation in case of Selenium app-specific actions.
- AWS access keys set in
./dc-app-performance-toolkit/app/util/k8s/aws_envsfile:AWS_ACCESS_KEY_IDAWS_SECRET_ACCESS_KEYAWS_SESSION_TOKEN(only for temporary creds)
- Make sure
-
Navigate to
dc-app-performance-toolkitfolder and start tests execution:1 2
export ENVIRONMENT_NAME=your_environment_name1 2
docker run --pull=always --env-file ./app/util/k8s/aws_envs \ -e REGION=us-east-2 \ -e ENVIRONMENT_NAME=$ENVIRONMENT_NAME \ -v "/$PWD:/data-center-terraform/dc-app-performance-toolkit" \ -v "/$PWD/app/util/k8s/bzt_on_pod.sh:/data-center-terraform/bzt_on_pod.sh" \ -it atlassianlabs/terraform:2.9.23 bash bzt_on_pod.sh jira.yml
Review results_summary.log file under artifacts dir location. Make sure that overall status is OK before moving to the next steps. For an enterprise-scale environment run, the acceptable success rate for actions is 95% and above.
Run 4 (~50 min)
Before scaling your DC make sure that AWS vCPU limit is not lower than needed number. Minimum recommended value is 50.
Use AWS Service Quotas service to see current limit for us-east-2 region.
EC2 CPU Limit section has instructions on how to increase limit if needed.
To receive scalability benchmark results for two-node Jira DC with app-specific actions:
-
Navigate to
dc-app-performance-toolkit/app/util/k8sfolder. -
Open
dcapt.tfvarsfile and setjira_replica_countvalue to2. -
From local terminal (Git Bash for Windows users) start scaling (~20 min):
1 2
docker run --pull=always --env-file aws_envs \ -v "/$PWD/dcapt.tfvars:/data-center-terraform/conf.tfvars" \ -v "/$PWD/dcapt-snapshots.json:/data-center-terraform/dcapt-snapshots.json" \ -v "/$PWD/logs:/data-center-terraform/logs" \ -it atlassianlabs/terraform:2.9.23 ./install.sh -c conf.tfvars -
Navigate to
dc-app-performance-toolkitfolder and start tests execution:1 2
export ENVIRONMENT_NAME=your_environment_name1 2
docker run --pull=always --env-file ./app/util/k8s/aws_envs \ -e REGION=us-east-2 \ -e ENVIRONMENT_NAME=$ENVIRONMENT_NAME \ -v "/$PWD:/data-center-terraform/dc-app-performance-toolkit" \ -v "/$PWD/app/util/k8s/bzt_on_pod.sh:/data-center-terraform/bzt_on_pod.sh" \ -it atlassianlabs/terraform:2.9.23 bash bzt_on_pod.sh jira.yml
Review results_summary.log file under artifacts dir location. Make sure that overall status is OK before moving to the next steps. For an enterprise-scale environment run, the acceptable success rate for actions is 95% and above.
Run 5 (~50 min)
Before scaling your DC make sure that AWS vCPU limit is not lower than needed number. Minimum recommended value is 50.
Use AWS Service Quotas service to see current limit for us-east-2 region.
EC2 CPU Limit section has instructions on how to increase limit if needed.
To receive scalability benchmark results for four-node Jira DC with app-specific actions:
-
Scale your Jira Data Center deployment to 4 nodes as described in Run 4.
-
Navigate to
dc-app-performance-toolkitfolder and start tests execution:1 2
export ENVIRONMENT_NAME=your_environment_name1 2
docker run --pull=always --env-file ./app/util/k8s/aws_envs \ -e REGION=us-east-2 \ -e ENVIRONMENT_NAME=$ENVIRONMENT_NAME \ -v "/$PWD:/data-center-terraform/dc-app-performance-toolkit" \ -v "/$PWD/app/util/k8s/bzt_on_pod.sh:/data-center-terraform/bzt_on_pod.sh" \ -it atlassianlabs/terraform:2.9.23 bash bzt_on_pod.sh jira.yml
Review results_summary.log file under artifacts dir location. Make sure that overall status is OK before moving to the next steps. For an enterprise-scale environment run, the acceptable success rate for actions is 95% and above.
Generating a report for scalability scenario
To generate a scalability report:
- Edit the
./app/reports_generation/scale_profile.ymlfile:- For
runName: "1 Node", in therelativePathkey, insert the relative path to results directory of Run 3. - For
runName: "2 Nodes", in therelativePathkey, insert the relative path to results directory of Run 4. - For
runName: "4 Nodes", in therelativePathkey, insert the relative path to results directory of Run 5.
- For
- Navigate locally to
dc-app-performance-toolkitfolder and run the following command from local terminal (Git Bash for Windows users) to generate reports:1 2
docker run --pull=always \ -v "/$PWD:/dc-app-performance-toolkit" \ --workdir="//dc-app-performance-toolkit/app/reports_generation" \ --entrypoint="python" \ -it atlassian/dcapt csv_chart_generator.py scale_profile.yml - In the
./app/results/reports/YY-MM-DD-hh-mm-ssfolder, view the.csvfile (with consolidated scenario results), the.pngchart file and performance scenario summary report. If you see an impact (>20%) on any action timing, we recommend taking a look into the app implementation to understand the root cause of this delta.
It is recommended to terminate an enterprise-scale environment after completing all tests. Follow Terminate enterprise-scale environment instructions. In case of any problems with uninstall use Force terminate command.
Attaching testing results to ECOHELP ticket
Do not forget to attach performance testing results to your ECOHELP ticket.
- Make sure you have two reports folders: one with performance profile and second with scale profile results.
Each folder should have
profile.csv,profile.png,profile_summary.logand profile run result archives. Archives should contain all raw data created during the run:bzt.log, selenium/jmeter/locust logs, .csv and .yml files, etc. - Attach two reports folders to your ECOHELP ticket.
Support
If the installation script fails on installing Helm release or any other reason, collect the logs, zip and share to community Slack #data-center-app-performance-toolkit channel. For instructions on how to collect detailed logs, see Collect detailed k8s logs. For failed cluster uninstall use Force terminate command.
In case of any technical questions or issues with DC Apps Performance Toolkit, contact us for support in the community Slack #data-center-app-performance-toolkit channel.
Rate this page: