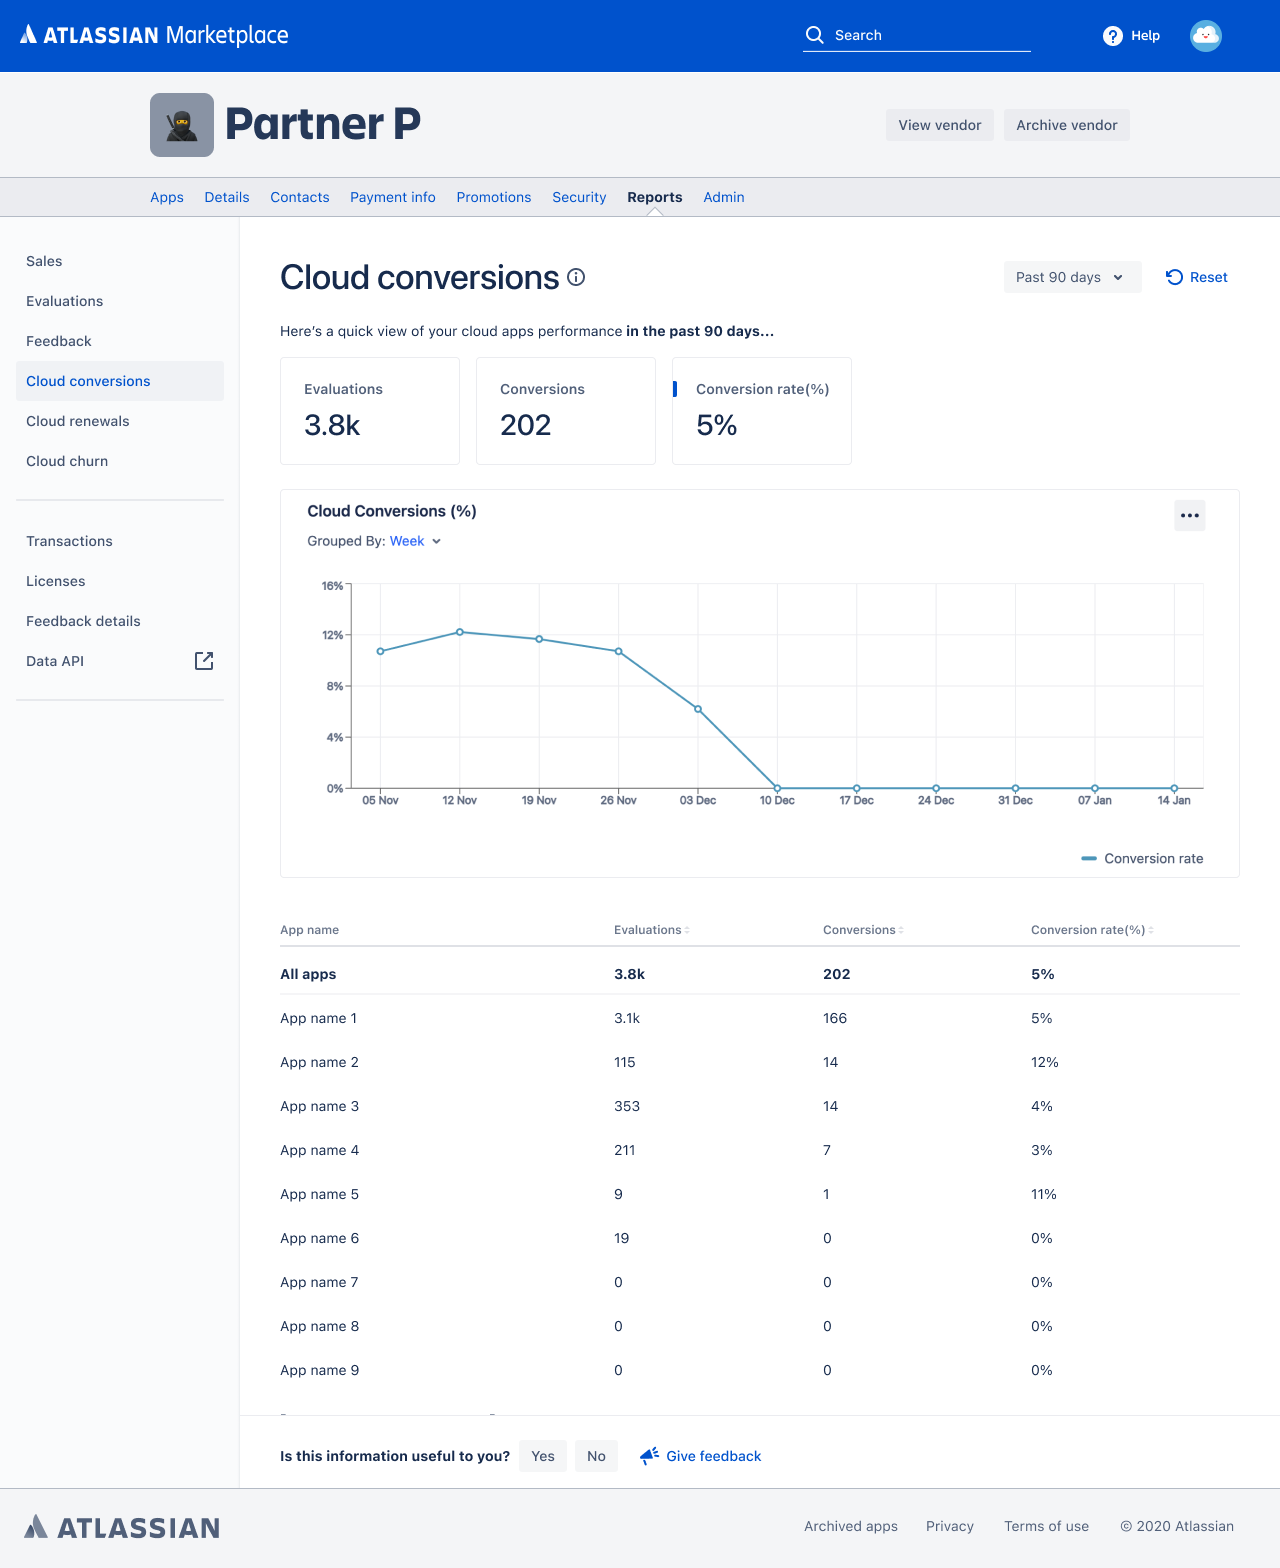
Cloud conversions
The Cloud conversions report shows you the data for the evaluations of your cloud apps that got converted to paid licenses.
You can view the conversion rate either for all your apps or for specific apps.
Filters
Filters offer different kinds of customizations. The date range filter provides multiple iterations to customize the dates. All the dates displayed are in UTC. These are your options:
- All dates
- Last 30 days
- Last 90 days
- This month to date
- Last month
- Year to date
- Last year
- Custom
Graph
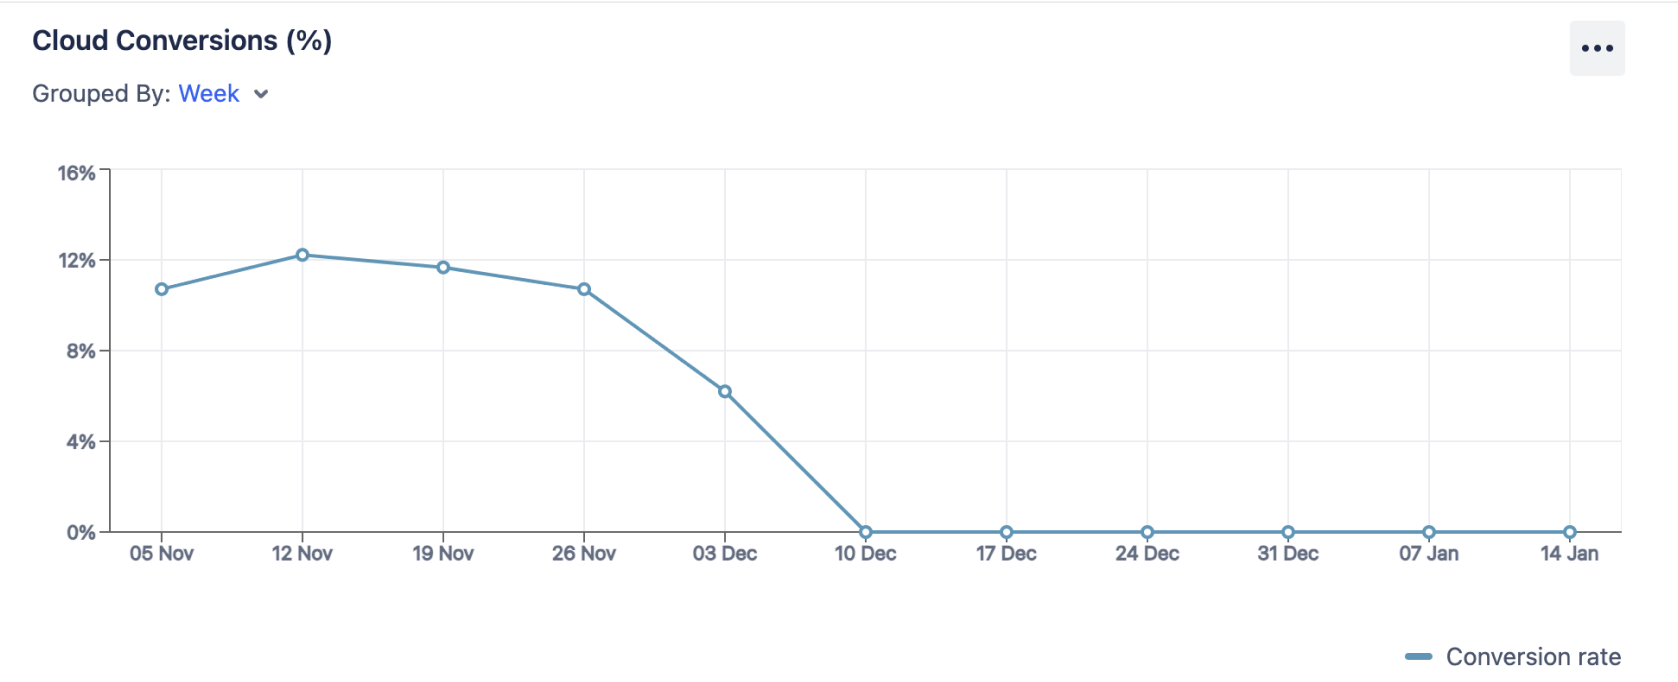
The cloud conversions are charted on a time-series graph where the Y-axis is the conversion rate. The graph depicts the cloud conversions based on the selected filter.
You can group the charts by week or month.
You can also toggle the chart patterns from the three dots on the top right and change them for better accessibility.
Table
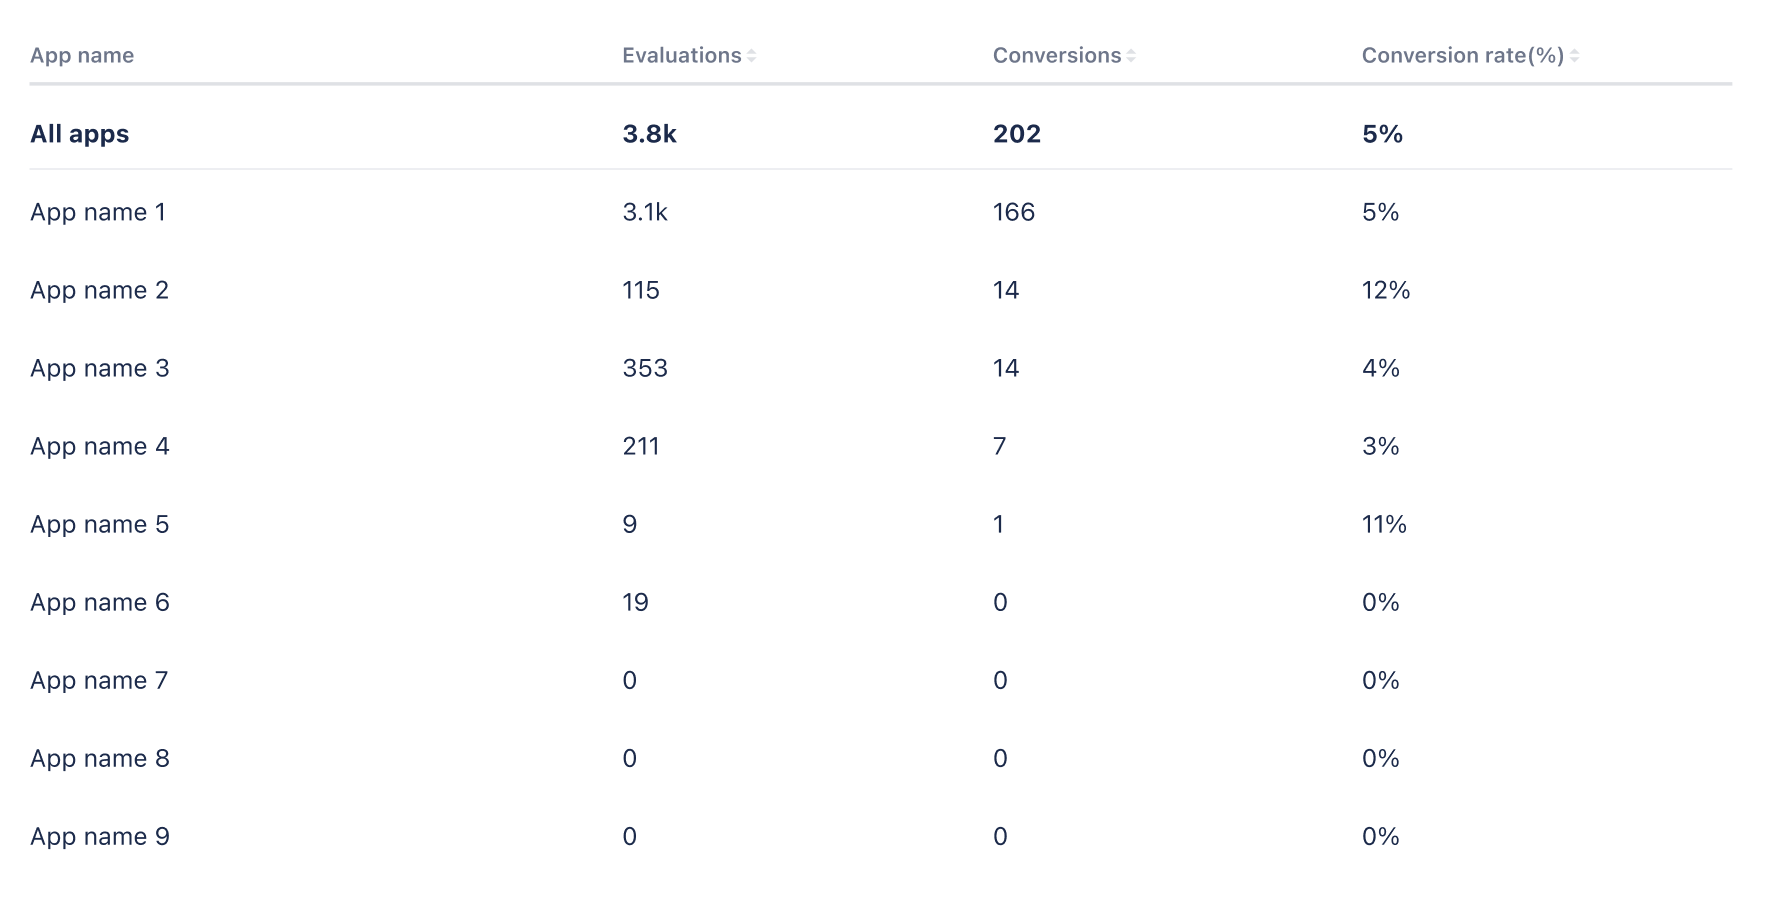
Within the table, your data is numerically displayed for all your apps as well as for specific apps.
You can see the number of evaluations at a particular point in time, the number of conversions during that period and the conversion rate.
- Cloud conversions: The number of active trials for your cloud apps that got converted into paid licenses.
- Evaluations: The number of active trials due for renewal for your cloud apps.
- Conversions: The number of active trials due for renewal for your cloud apps that got converted.
- Conversion rate: (Number of new paid licenses) / (Number of evaluations) in the specified date range.
For information about other terms used in the reports, check out the glossary.
Rate this page: