Monitor your Cloud Fortified apps
You must be the app vendor or the app vendor’s contact to view metrics for your app.
To find out if you are the app vendor’s contact or to add a new contact, see About the Atlassian Marketplace.
View app metrics
App metrics show you how your app is currently performing across all sites.
To view app metrics:
-
Access the developer console.
-
Select the Forge app that you want to view metrics for.
-
Select Metrics in the left menu.
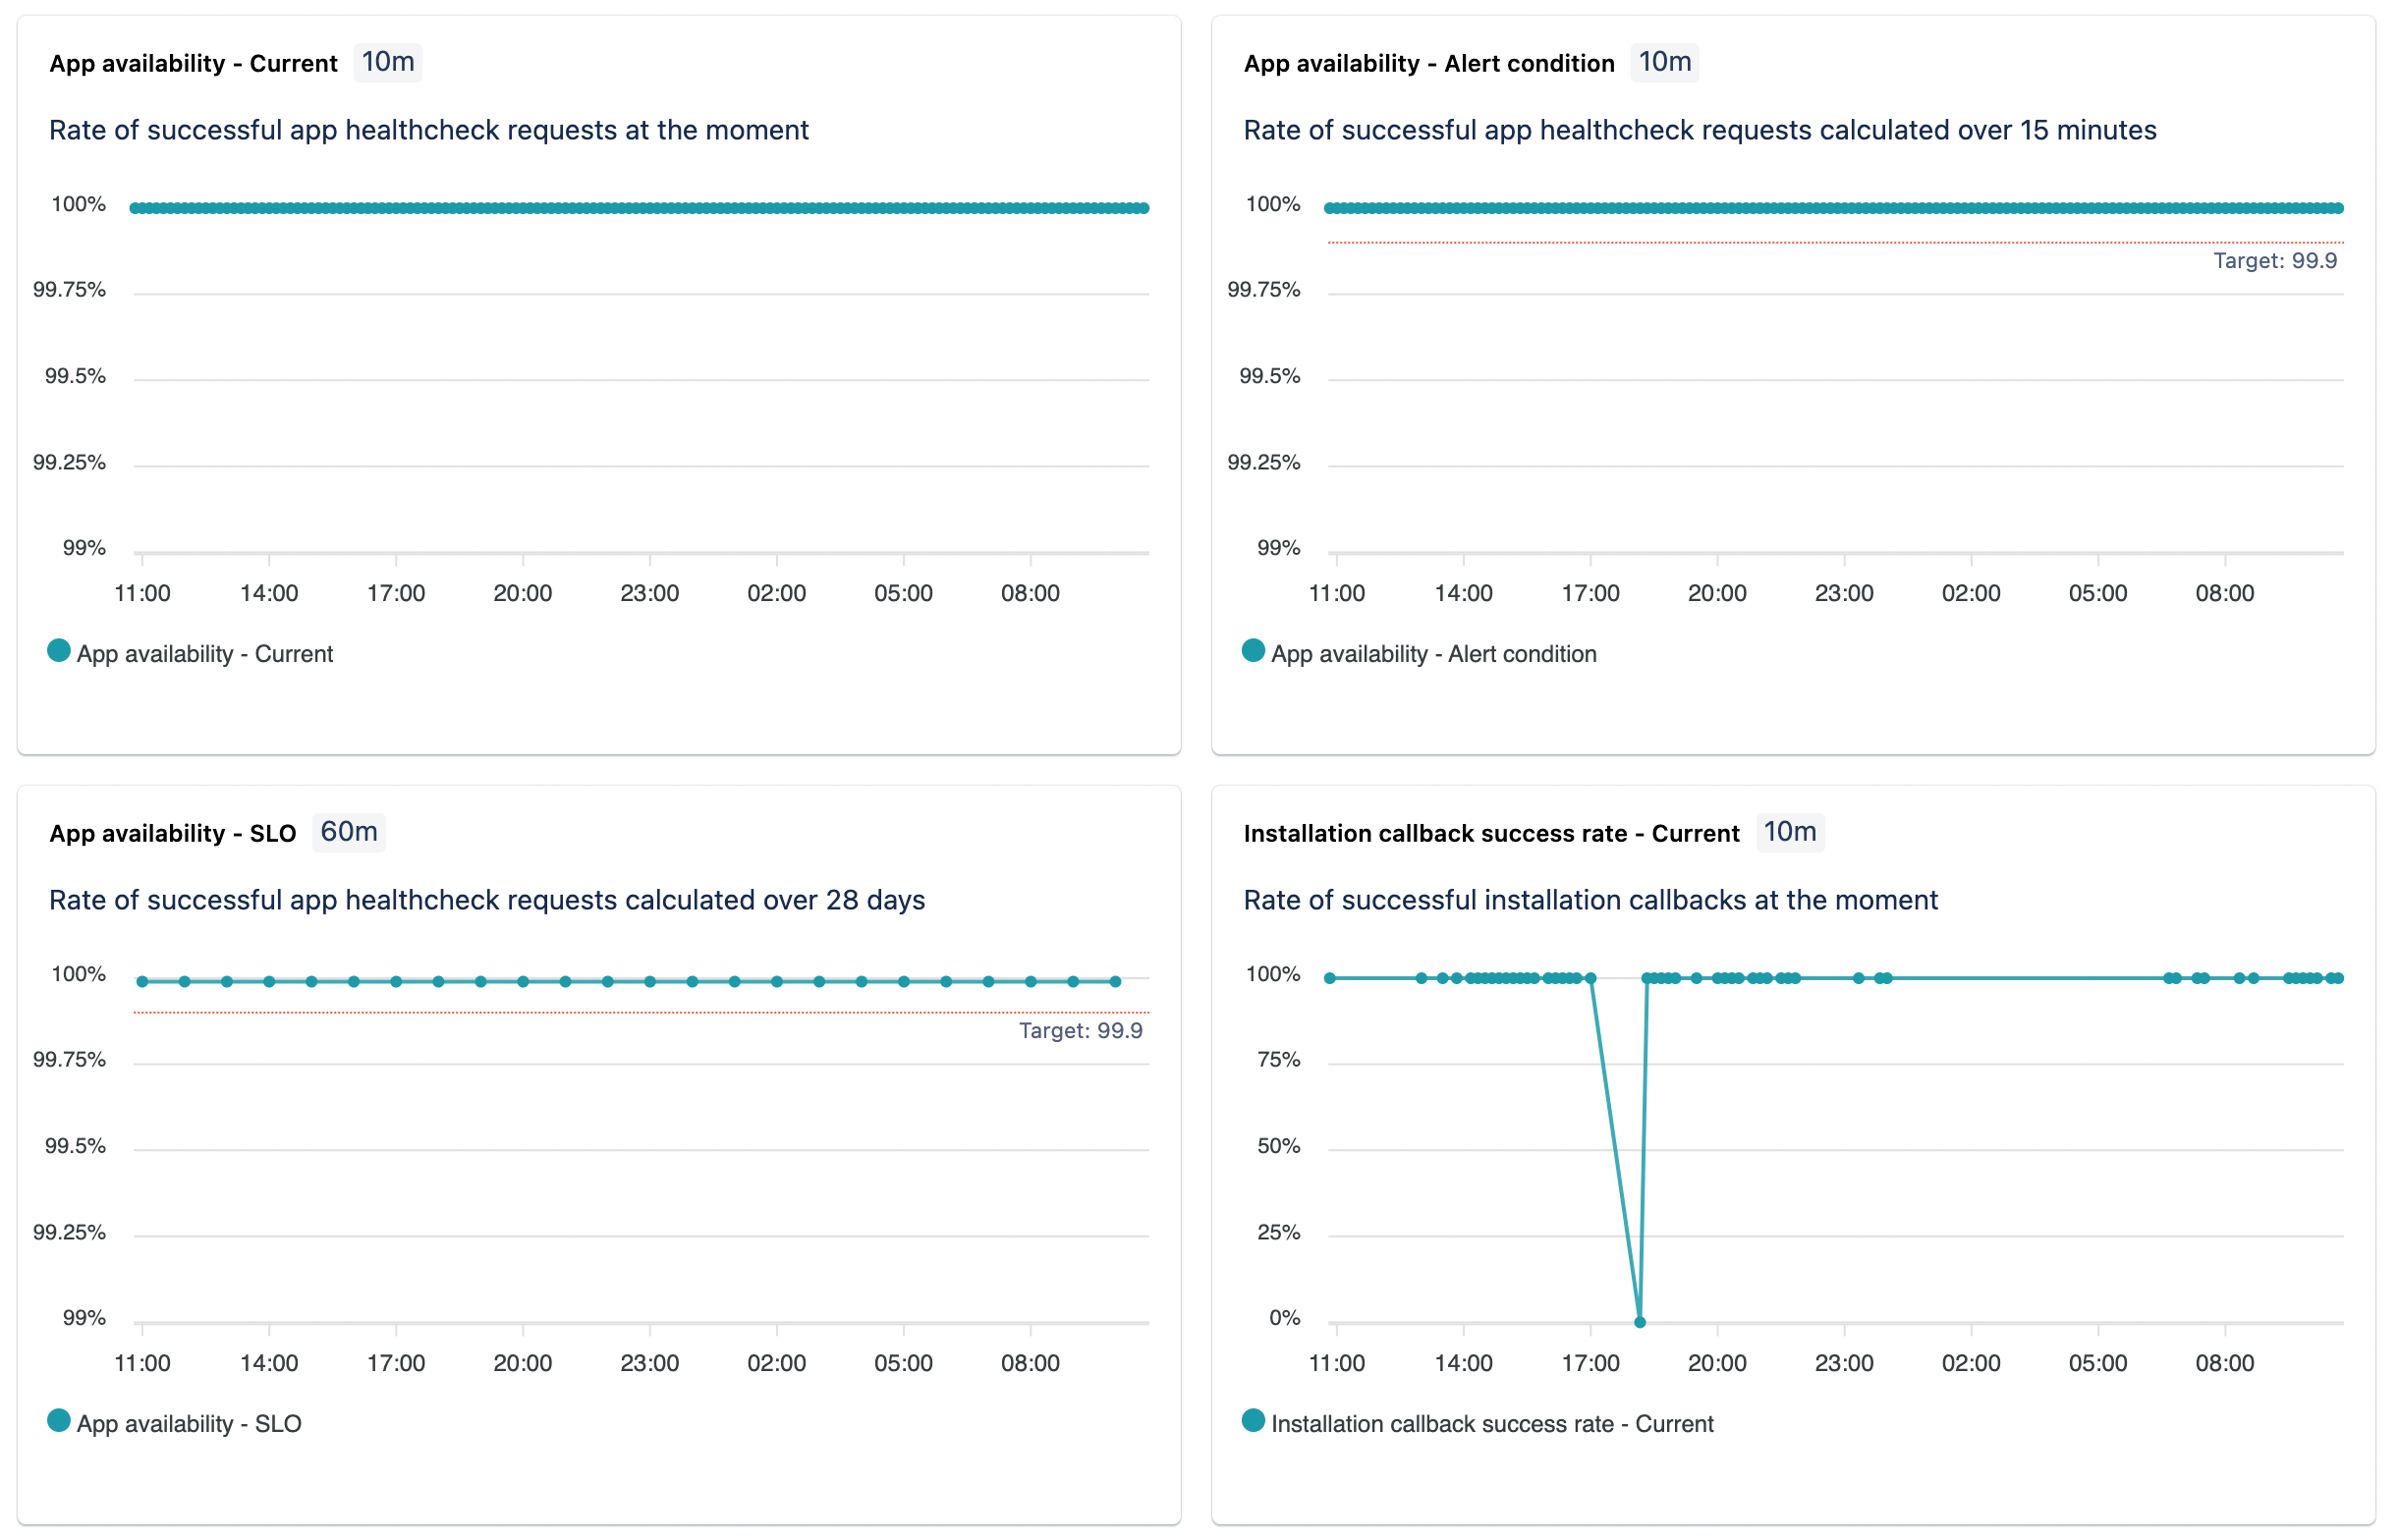
Metrics
The app’s performance is measured by the following metrics:
- Installation callback success rate: Current rate of successful installations.
- Installation callback success rate - Alert condition: Rate of successful installations calculated over 24 hours.
- Installation callback success rate - SLO: Rate of successful installations calculated over 28 days.
Filtering
Use the Date filter to narrow down the metrics based on your chosen time interval.
Select from a range of predefined values, such as the Last 24 hours, or select a more specific time interval using the Custom option.
Note:
- Metrics are only shown for sites with at least one invocation in the past 14 days.
- All dates are in Coordinated Universal Time (UTC).
- Each chart's data resolution depends on the time interval you've selected. For example 'Last 24 hours' shows data at a 30-minute resolution, and 'Last hour' shows data at a 1-minute resolution.
- Metrics may not always be accurate because undelivered metrics data isn’t back-filled and data sampling might be used for some metrics.
You can bookmark the URL on your browser to access metrics based on specific filtering criteria for quick access.
You must use data in accordance with the privacy rights that you've obtained from your user. For more information, see the Atlassian Developer Terms.
Rate this page: